PWD IntelligenceThe ETF Flow ReportWeek of Nov 16
Net flows, the week
−$3.6B
down $20.7BChange vs the prior week
Source for Net flows, the week
Source: Amplify ETFs, Avantis Investors, Capital Group, NEOS Investments, YieldMax ETFs, iShares (BlackRock) published daily NAV and shares outstanding; flow = change in shares outstanding x NAVSix issuers' ETF flows turn negative after $3.62B week
Active ETFs took in $2.31 billion while index ETFs lost $5.93 billion, and fixed income shed $3.94 billion.
Share
By PWD Intelligence7 min read
Gross inflows
$15B
325 funds took in money
Source for Gross inflows
Source: Amplify ETFs, Avantis Investors, Capital Group, NEOS Investments, YieldMax ETFs, iShares (BlackRock) published daily NAV and shares outstanding; flow = change in shares outstanding x NAVGross outflows
−$18.6B
203 funds lost money
Source for Gross outflows
Source: Amplify ETFs, Avantis Investors, Capital Group, NEOS Investments, YieldMax ETFs, iShares (BlackRock) published daily NAV and shares outstanding; flow = change in shares outstanding x NAVTop five funds' share of inflows
26.7%
TLH, SGOV, IVV, SYSB, EWG
Source for Top five funds' share of inflows
Source: Amplify ETFs, Avantis Investors, Capital Group, NEOS Investments, YieldMax ETFs, iShares (BlackRock) published daily NAV and shares outstanding; flow = change in shares outstanding x NAVFunds covered
585
Issuers: Amplify ETFs, Avantis Investors, Capital Group, NEOS Investments, YieldMax ETFs, iShares (BlackRock)
Source for Funds covered
Source: Amplify ETFs, Avantis Investors, Capital Group, NEOS Investments, YieldMax ETFs, iShares (BlackRock) published daily NAV and shares outstanding; flow = change in shares outstanding x NAVWhat matters
- Covered ETFs recorded a net outflow of $3.62 billion in the week to Nov. 15, the only negative week of the four in the window, after net inflows of $9.48 billion, $7.23 billion and $17.12 billion in the three weeks before, according to issuers' published daily fund records.
- Treasury funds drove the swing, with the Treasuries category shedding $3.75 billion after taking in $2.61 billion the week before, according to issuers' published daily fund records.
- Active ETFs took in $2.31 billion in the week to Nov. 15 while index ETFs lost $5.93 billion, according to issuers' published daily fund records.
Chart 1
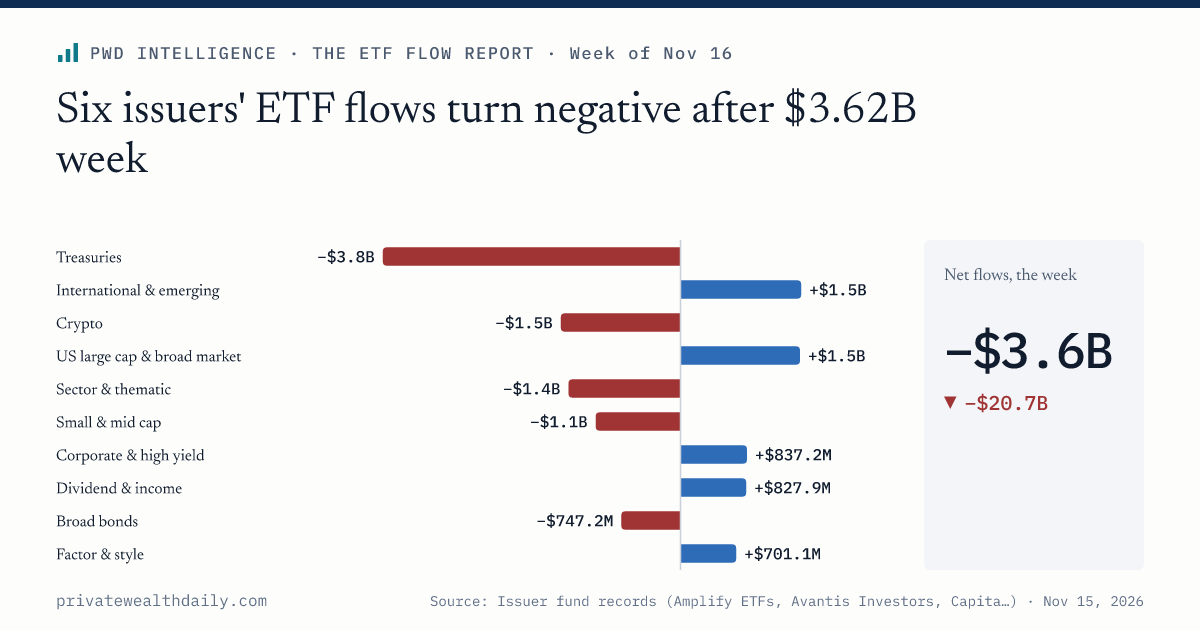
Net ETF flows by category, week to Nov 15
Inflows above zero, outflows below; issuer-reported funds only
- Above zero
- Below zero
- International & emerging+$1.5B
- US large cap & broad market+$1.5B
- Corporate & high yield+$837.2M
- Dividend & income+$827.9M
- Factor & style+$701.1M
- Broad bonds−$747.2M
- Small & mid cap−$1.1B
- Sector & thematic−$1.4B
- Crypto−$1.5B
- Treasuries−$3.8B
Show as table
| Label | Value ($) |
|---|---|
| Treasuries | −$3.8B |
| International & emerging | +$1.5B |
| Crypto | −$1.5B |
| US large cap & broad market | +$1.5B |
| Sector & thematic | −$1.4B |
| Small & mid cap | −$1.1B |
| Corporate & high yield | +$837.2M |
| Dividend & income | +$827.9M |
| Broad bonds | −$747.2M |
| Factor & style | +$701.1M |
ETFs from six issuers lost a net $3.62 billion in the week to Nov. 15, ending three straight weekly inflows that totaled $33.83 billion, according to the issuers' published daily fund records.
Gross inflows of $15.03 billion fell short of $18.64 billion in gross outflows, and 325 of the 585 funds with flows still took in money against 203 that lost it. Gross activity of $33.67 billion produced that $3.62 billion net, so most of the week's creations and redemptions offset each other. The prior weeks brought $9.48 billion, $7.23 billion and $17.12 billion; the four-week net remains positive at $30.21 billion.
For advisors running Treasury exposure in client bond sleeves, the week's selling was concentrated in government funds. Treasuries lost $3.75 billion while fixed income overall lost $3.94 billion: Corporate & high yield funds added $837 million, Broad bonds lost $747 million and Municipal bonds $228 million. A client rebalancing that adds duration in the coming weeks will be trading against that flow. The records count shares created and redeemed, not who sold or what they bought.
The figures cover 585 funds holding $4.76 trillion in assets from Amplify ETFs, Avantis Investors, Capital Group, NEOS Investments, YieldMax ETFs and iShares (BlackRock) over the four weeks to Nov. 15. They are not a market-wide flow total.
Chart 2
Net flows by week
Weeks ending on the date shown
- Inflow / above zero
- Outflow / below zero
Show as table
| Label | Value ($) |
|---|---|
| Oct 25 | $9.5B |
| Nov 1 | $7.2B |
| Nov 8 | $17.1B |
| Nov 15 | −$3.6B |
Four weeks of net flows across every covered fund.
Treasuries posted the largest category outflow
Treasuries lost $3.75 billion after taking in $2.61 billion the week before, the largest outflow among the 18 categories in the records. Its four weekly readings ran +$1.27 billion, -$803 million, +$2.61 billion and -$3.75 billion.
Crypto lost $1.51 billion, Sector & thematic $1.41 billion and Small & mid cap $1.07 billion. Sector & thematic had taken in $984 million the week before.
International & emerging took in $1.52 billion and US large cap & broad market $1.51 billion, both below the $2.79 billion and $6.36 billion they drew a week earlier. Dividend & income added $828 million against $354 million the prior week, and the Other category took in $256 million.
Table 1
Net flows by category
| Category↕ | This week↕ | Prior week↕ | Four weeks↓ | Funds↕ | 4 weeks |
|---|---|---|---|---|---|
| Corporate & high yield | ▲+$837M | ▲+$2.3B | ▲+$9B | 52 | |
| US large cap & broad market | ▲+$1.5B | ▲+$6.4B | ▲+$7.8B | 22 | |
| International & emerging | ▲+$1.5B | ▲+$2.8B | ▲+$7.2B | 90 | |
| Sector & thematic | ▼−$1.4B | ▲+$984M | ▲+$4.5B | 30 | |
| Municipal bonds | ▼−$228M | ▲+$484M | ▲+$3.5B | 19 | |
| Small & mid cap | ▼−$1.1B | ▲+$3.1B | ▲+$1.7B | 16 | |
| Dividend & income | ▲+$828M | ▲+$354M | ▲+$1.4B | 27 | |
| Broad bonds | ▼−$747M | ▼−$191M | ▲+$830M | 48 | |
| Gold & precious metals | ▼−$47.7M | ▲+$78.9M | ▲+$309M | 6 | |
| Factor & style | ▲+$701M | ▲+$825M | ▲+$290M | 48 | |
| Other | ▲+$256M | ▼−$3.5M | ▲+$194M | 26 | |
| Commodities | ▼−$3.1M | ▼−$12.2M | ▲+$48.4M | 7 | |
| Buffer & defined outcome | ▲+$1.2M | ▲+$20.4M | ▲+$34.1M | 8 | |
| Option income | ▼−$40.1M | ▲+$1.8M | ▼−$46.5M | 60 | |
| Treasuries | ▼−$3.8B | ▲+$2.6B | ▼−$679M | 33 | |
| Real estate | ▼−$270M | ▼−$336M | ▼−$994M | 10 | |
| Other equity | ▼−$186M | ▼−$936M | ▼−$2.2B | 73 | |
| Crypto | ▼−$1.5B | ▼−$1.4B | ▼−$2.6B | 10 |
1–18 of 18
Source: Amplify ETFs, Avantis Investors, Capital Group, NEOS Investments, YieldMax ETFs, iShares (BlackRock) published daily NAV and shares outstanding; flow = change in shares outstanding x NAV; categories classified from fund names by fixed rules
Equity inflows fell to $802 million
Equity funds took in $802 million, down from $13.35 billion a week earlier, while fixed income swung to a $3.94 billion outflow from a $5.27 billion inflow, the records show.
Each weekly figure is the change in shares outstanding multiplied by NAV, so it measures shares created and redeemed rather than fund returns. A fund can post an outflow in a week its holdings rise.
Chart 3
Weekly net flows by asset class
Asset class as each issuer declares it
- Equity
- Fixed income
- Digital Assets
- Other
Show as table
| Label | Equity | Fixed income | Digital Assets | Other | Total |
|---|---|---|---|---|---|
| Oct 25 | $2.7B | $7B | $325.8M | −$532.7M | $9.5B |
| Nov 1 | $2.7B | $4.2B | −$20M | $280.5M | $7.2B |
| Nov 8 | $13.4B | $5.3B | −$1.4B | −$131.2M | $17.1B |
| Nov 15 | $802.1M | −$3.9B | −$1.5B | $1.1B | −$3.6B |
Chart 4
Assets by asset class, indexed to 100
Same 7 funds every day; includes market moves
- Equity
- Fixed income
Show as table
| Period | Equity | Equity (index) | Fixed income | Fixed income (index) |
|---|---|---|---|---|
| Oct 19 | 42.3B | 100.0 | 9.7B | 100.0 |
| Oct 20 | 42.5B | 100.3 | 9.7B | 100.1 |
| Oct 21 | 42.8B | 101.0 | 9.7B | 100.1 |
| Oct 22 | 42.1B | 99.6 | 9.8B | 100.6 |
| Oct 23 | 42B | 99.2 | 9.8B | 100.5 |
| Oct 26 | 42.4B | 100.2 | 9.8B | 100.8 |
| Oct 27 | 42.7B | 100.8 | 9.8B | 100.9 |
| Oct 28 | 42.9B | 101.3 | 9.8B | 100.8 |
| Oct 29 | 42.6B | 100.7 | 9.8B | 101.0 |
| Oct 30 | 41.8B | 98.8 | 9.9B | 101.3 |
| Nov 2 | 41.5B | 98.1 | 9.8B | 101.0 |
| Nov 3 | 41.8B | 98.7 | 9.8B | 100.9 |
| Nov 4 | 42.3B | 99.8 | 9.8B | 101.2 |
| Nov 5 | 40.4B | 95.4 | 9.9B | 101.4 |
| Nov 6 | 40.6B | 96.0 | 9.9B | 101.4 |
| Nov 9 | 41.7B | 98.4 | 9.9B | 101.5 |
| Nov 10 | 41.6B | 98.2 | 9.8B | 101.0 |
| Nov 11 | 42.2B | 99.7 | 9.8B | 101.0 |
| Nov 12 | 42.2B | 99.7 | 9.8B | 100.6 |
| Nov 13 | 42.1B | 99.5 | 9.8B | 100.5 |
Active funds took in $2.31 billion, index funds lost $5.93 billion
Active ETFs took in $2.31 billion while index ETFs lost $5.93 billion, the records show. The two sum to the group's net outflow for the week, so the index side supplied the entire decline and more. The records classify 115 funds as active and 470 as index.
Across the four weeks, active funds account for $3.16 billion of the $30.21 billion net total. The one negative week equals 12% of that four-week total.
Chart 5
Weekly net flows, active vs index funds
- Active
- Index
Show as table
| Label | Active | Index | Total |
|---|---|---|---|
| Oct 25 | $324.6M | $9.2B | $9.5B |
| Nov 1 | $233.7M | $7B | $7.2B |
| Nov 8 | $293.7M | $16.8B | $17.1B |
| Nov 15 | $2.3B | −$5.9B | −$3.6B |
Four funds supplied a quarter of gross outflows
SOXX lost $1.47 billion, TLT $1.20 billion, IBIT $1.14 billion and IEF $939 million, $4.75 billion combined, about a quarter of the $18.64 billion in gross outflows, the records show.
The largest inflows named in the records were TLH at $1.75 billion, SGOV at $613 million and IVV at $612 million, $2.97 billion against $15.03 billion of gross inflows.
Chart 6
Largest fund inflows and outflows, week to Nov 15
- Above zero
- Below zero
- TLH+$1.7B
- SGOV+$613.3M
- IVV+$612.5M
- SYSB+$549M
- EWG+$486.6M
- IEF−$939.3M
- IBIT−$1.1B
- TLT−$1.2B
- SOXX−$1.5B
- GOVT−$3.8B
Show as table
| Label | Value ($) |
|---|---|
| TLH | +$1.7B |
| SGOV | +$613.3M |
| IVV | +$612.5M |
| SYSB | +$549M |
| EWG | +$486.6M |
| GOVT | −$3.8B |
| SOXX | −$1.5B |
| TLT | −$1.2B |
| IBIT | −$1.1B |
| IEF | −$939.3M |
Table 2
Largest inflows and outflows, week to Nov 15
| Ticker↕ | Fund↕ | Category↕ | Net flow↕ | Assets↕ | 4 weeks |
|---|---|---|---|---|---|
| TLH | iShares 10-20 Year Treasury Bond ETF | Treasuries | ▲+$1.7B | $13.8B | |
| SGOV | iShares 0-3 Month Treasury Bond ETF | Treasuries | ▲+$613M | $117B | |
| IVV | iShares Core S&P 500 ETF | US large cap & broad market | ▲+$612M | $875B | |
| SYSB | iShares Systematic Bond ETF | Broad bonds | ▲+$549M | $1.9B | |
| EWG | iShares MSCI Germany ETF | Other equity | ▲+$487M | $2.1B | |
| INDA | iShares MSCI India ETF | International & emerging | ▲+$440M | $6.8B | |
| IWR | iShares Russell Mid-Cap ETF | Small & mid cap | ▲+$382M | $58.7B | |
| LQD | iShares iBoxx $ Investment Grade Corporate Bond ETF | Corporate & high yield | ▲+$381M | $32.8B | |
| GOVT | iShares U.S. Treasury Bond ETF | Treasuries | ▼−$3.8B | $38.8B | |
| SOXX | iShares Semiconductor ETF | Sector & thematic | ▼−$1.5B | $41.2B | |
| TLT | iShares 20+ Year Treasury Bond ETF | Treasuries | ▼−$1.2B | $46.2B | |
| IBIT | iShares Bitcoin Trust | Crypto | ▼−$1.1B | $54.1B | |
| IEF | iShares 7-10 Year Treasury Bond ETF | Treasuries | ▼−$939M | $42.8B | |
| IVE | iShares S&P 500 Value ETF | Factor & style | ▼−$921M | $50.7B | |
| IWM | iShares Russell 2000 ETF | Small & mid cap | ▼−$828M | $76.8B | |
| IUSB | iShares Core Total USD Bond Market ETF | Broad bonds | ▼−$826M | $48.9B |
1–16 of 16
Source: Amplify ETFs, Avantis Investors, Capital Group, NEOS Investments, YieldMax ETFs, iShares (BlackRock) published daily NAV and shares outstanding; flow = change in shares outstanding x NAV
SOXX swung $3.83 billion from inflow to outflow
SOXX had averaged $2.36 billion a week in inflows over the prior three weeks before losing $1.47 billion, a swing of about $3.83 billion.
TLT and IEF together lost $2.14 billion, 57% of the Treasuries category's outflow.
Chart 7
Reversals: prior three-week average vs this week
Show as table
| Item | 3-week avg | This week | Change |
|---|---|---|---|
| GOVT | $150.6M | −$3.8B | −$4B |
| SOXX | $2.4B | −$1.5B | −$3.8B |
| TLT | $245.8M | −$1.2B | −$1.4B |
| IEF | $819.1M | −$939.3M | −$1.8B |
| IVE | $115.4M | −$921M | −$1B |
| IWM | $173.7M | −$828.1M | −$1B |
PWD Intelligence
The ETF Flow Report
New editions publish on a fixed schedule. Follow the series to see each one on My Desk.
Free. Every morning. Unsubscribe from any edition in one click.
From other sections
- ETF DailyTaiwan active ETF market grows 105-fold in a year
- Digital Capital DailyBlackRock's IBIT accounts for 94% of weekly spot bitcoin ETF outflows
- Wealth Advisor DailyFidelity, Capital Group and BlackRock funds hold $15 billion of Anthropic
- Deals & PEMorgan Stanley AIP reports $888.6 million across six DES funds