PWD IntelligenceThe ETF Flow ReportWeek of Nov 2
Net flows, the week
$7.5B
down $2.2BChange vs the prior week
Source for Net flows, the week
Source: iShares (BlackRock) published daily NAV and shares outstanding; flow = change in shares outstanding x NAVSHV sheds $2.14 billion as iShares credit and S&P 500 funds gain
Net inflows across 431 iShares funds slowed to $7.55 billion in the week to Nov. 1 from $9.78 billion the week before.
Share
By PWD Intelligence9 min read
Gross inflows
$16.2B
287 funds took in money
Source for Gross inflows
Source: iShares (BlackRock) published daily NAV and shares outstanding; flow = change in shares outstanding x NAVGross outflows
−$8.6B
143 funds lost money
Source for Gross outflows
Source: iShares (BlackRock) published daily NAV and shares outstanding; flow = change in shares outstanding x NAVTop five funds' share of inflows
39.5%
LQD, IVV, IEF, SOXX, HYG
Source for Top five funds' share of inflows
Source: iShares (BlackRock) published daily NAV and shares outstanding; flow = change in shares outstanding x NAVFunds covered
431
Issuers: iShares (BlackRock)
Source for Funds covered
Source: iShares (BlackRock) published daily NAV and shares outstanding; flow = change in shares outstanding x NAVWhat matters
- SHV, the iShares Short Treasury Bond ETF, lost $2.14 billion in the week to Nov 1, the largest fund outflow of the week in iShares' published daily fund data, while LQD, HYG, IVV and IEF took in $5.34 billion combined.
- Corporate and high yield funds took in $3.78 billion in the week to Nov 1, up from $2.00 billion the prior week and the largest of the 18 fund categories, according to iShares' published daily fund data.
- IWD, the iShares Russell 1000 Value ETF, flipped to a $1.72 billion outflow after averaging $146 million a week of inflows over the prior three weeks, according to iShares' published daily fund data.
Chart 1
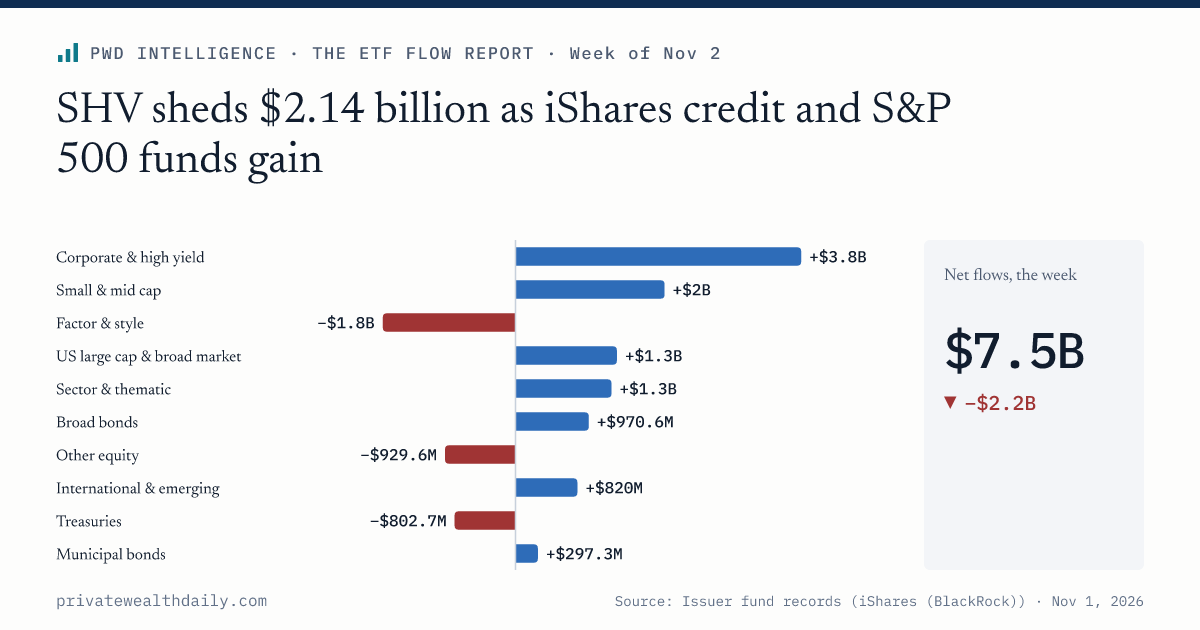
Net ETF flows by category, week to Nov 1
Inflows above zero, outflows below; issuer-reported funds only
- Above zero
- Below zero
- Corporate & high yield+$3.8B
- Small & mid cap+$2B
- US large cap & broad market+$1.3B
- Sector & thematic+$1.3B
- Broad bonds+$970.6M
- International & emerging+$820M
- Municipal bonds+$297.3M
- Treasuries−$802.7M
- Other equity−$929.6M
- Factor & style−$1.8B
Show as table
| Label | Value ($) |
|---|---|
| Corporate & high yield | +$3.8B |
| Small & mid cap | +$2B |
| Factor & style | −$1.8B |
| US large cap & broad market | +$1.3B |
| Sector & thematic | +$1.3B |
| Broad bonds | +$970.6M |
| Other equity | −$929.6M |
| International & emerging | +$820M |
| Treasuries | −$802.7M |
| Municipal bonds | +$297.3M |
Investors pulled $2.14 billion from SHV, the iShares Short Treasury Bond ETF, in the week to Nov. 1, the largest outflow among 431 iShares funds, according to iShares' published daily fund data.
Four iShares funds, LQD, HYG, IVV and IEF, took in $5.34 billion combined in the same week, iShares data show. That fits a rotation from short-dated Treasuries into investment-grade credit, high-yield credit, the S&P 500 and intermediate Treasuries. Flow data cannot show that the same money moved from one fund to another.
Advisors holding SHV in client portfolios saw the fund lose about 10% of its $21.4 billion in Oct. 30 assets in a single week, iShares data show. SHV's previous three weeks were +$29 million, -$196 million and +$110 million, so this outflow was more than ten times its largest recent weekly outflow. Other big moves were also large relative to fund size: EWZ's $1.09 billion outflow was about 11% of its $9.62 billion, and IGOV's $303 million about 29% of its $1.03 billion.
Net flow across the 431 funds, which hold $4.46 trillion, was $7.55 billion, down from $9.78 billion the prior week and $15.03 billion the week before that, iShares data show. Gross inflows of $16.19 billion across 287 funds were set against $8.64 billion of gross outflows across 143 funds. The figures cover iShares funds only, not the whole ETF market.
The Oct. 11 bars in the charts below are not usable flows. iShares' daily fund data computes a flow of -$289.6 trillion for that week from an anomalous share-count reading in EWZ, so comparisons here use the weeks of Oct. 18 and Oct. 25.
Chart 2
Net flows by week
Weeks ending on the date shown
- Inflow / above zero
- Outflow / below zero
Show as table
| Label | Value ($) |
|---|---|
| Oct 11 | −$289.6T |
| Oct 18 | $15B |
| Oct 25 | $9.8B |
| Nov 1 | $7.5B |
Four weeks of net flows across every covered fund.
Credit funds led the categories with $3.78 billion of inflows
Corporate and high-yield funds took in $3.78 billion, up from $2.00 billion the prior week and the most of the 18 fund categories, according to iShares data. Three funds supplied about 92% of it: LQD took in $1.70 billion, HYG $1.05 billion and USHY $738 million, together $3.49 billion of the category's 49 funds.
Equity categories reversed. Small and mid-cap funds took in $1.97 billion after losing $2.36 billion the prior week, and US large-cap and broad market funds took in $1.34 billion after losing $1.39 billion, iShares data show. Factor and style funds went the other way, to -$1.75 billion from +$516 million, and Treasuries fell to -$803 million from +$1.27 billion.
Municipal bond, sector and thematic, and international and emerging market funds together took in $2.39 billion, against $8.68 billion the week before. That drop is why total net flow fell even as credit and broad equity accelerated. Thirteen of the 18 categories took in money.
Table 1
Net flows by category
| Category↓ | This week↕ | Prior week↕ | Four weeks↕ | Funds↕ | 4 weeks |
|---|---|---|---|---|---|
| US large cap & broad market | ▲+$1.3B | ▼−$1.4B | ▼−$365M | 20 | |
| Treasuries | ▼−$803M | ▲+$1.3B | ▲+$1.6B | 31 | |
| Small & mid cap | ▲+$2B | ▼−$2.4B | ▲+$3.4B | 13 | |
| Sector & thematic | ▲+$1.3B | ▲+$3.7B | ▲+$4.4B | 26 | |
| Real estate | ▼−$9.5M | ▼−$378M | ▼−$597M | 8 | |
| Other equity | ▼−$930M | ▼−$147M | ▼−$290T | 69 | |
| Other | ▲+$23.9M | ▼−$83.3M | ▲+$47.3M | 14 | |
| Option income | ▲+$6M | ▼−$14.2M | ▼−$131M | 5 | |
| Municipal bonds | ▲+$297M | ▲+$3B | ▲+$5.9B | 16 | |
| International & emerging | ▲+$820M | ▲+$2B | ▲+$6.6B | 72 | |
| Gold & precious metals | ▲+$251M | ▲+$26.6M | ▲+$527M | 3 | |
| Factor & style | ▼−$1.8B | ▲+$516M | ▲+$4.7B | 41 | |
| Dividend & income | ▼−$47.3M | ▲+$251M | ▲+$213M | 7 | |
| Crypto | ▲+$292M | ▲+$630M | ▲+$1.8B | 2 | |
| Corporate & high yield | ▲+$3.8B | ▲+$2B | ▲+$7.2B | 49 | |
| Commodities | ▲+$63.7M | ▼−$9.5K | ▲+$109M | 6 | |
| Buffer & defined outcome | ▲+$1.1M | ▲+$11.4M | ▲+$26.8M | 8 | |
| Broad bonds | ▲+$971M | ▲+$772M | ▲+$3.2B | 41 |
1–18 of 18
Source: iShares (BlackRock) published daily NAV and shares outstanding; flow = change in shares outstanding x NAV; categories classified from fund names by fixed rules
Fixed income inflows slowed by $2.75 billion while equity held steady
Fixed income funds took in $4.25 billion, down from $7.00 billion the prior week, while equity funds took in $2.73 billion against $2.69 billion, according to iShares data. The $2.75 billion drop in fixed income was larger than the roughly $2.2 billion fall in total net flow, so the whole slowdown came from bonds. Fixed income has still taken in $17.70 billion over four weeks.
Assets moved differently from flows. Between Oct. 5 and Oct. 30, equity assets in the indexed series fell about 2.0% while fixed income assets rose about 2.2%, iShares data show. Equity funds had net inflows in each of the three weeks after Oct. 11, which is consistent with market moves outweighing flows in the equity asset line.
Chart 3
Weekly net flows by asset class
Asset class as each issuer declares it
- Equity
- Fixed income
- Digital Assets
- Other
Show as table
| Label | Equity | Fixed income | Digital Assets | Other | Total |
|---|---|---|---|---|---|
| Oct 11 | −$289.6T | $7B | $142.6M | $57.2M | −$289.6T |
| Oct 18 | $14.6B | −$579M | $780.6M | $230.3M | $15B |
| Oct 25 | $2.7B | $7B | $630.1M | −$532.7M | $9.8B |
| Nov 1 | $2.7B | $4.2B | $292.3M | $280.5M | $7.5B |
Chart 4
Assets by asset class, indexed to 100
Same 7 funds every day; includes market moves
- Equity
- Fixed income
Show as table
| Period | Equity | Equity (index) | Fixed income | Fixed income (index) |
|---|---|---|---|---|
| Oct 5 | 42.7B | 100.0 | 9.6B | 100.0 |
| Oct 6 | 42.9B | 100.6 | 9.7B | 100.1 |
| Oct 7 | 42.8B | 100.2 | 9.7B | 100.1 |
| Oct 8 | 42.6B | 99.9 | 9.7B | 100.3 |
| Oct 9 | 42.9B | 100.7 | 9.7B | 100.3 |
| Oct 12 | 43B | 100.7 | 9.7B | 100.6 |
| Oct 13 | 42.9B | 100.7 | 9.7B | 100.7 |
| Oct 14 | 42.5B | 99.6 | 9.7B | 100.6 |
| Oct 15 | 42.5B | 99.7 | 9.7B | 101.0 |
| Oct 16 | 42.1B | 98.7 | 9.7B | 101.0 |
| Oct 19 | 42.3B | 99.2 | 9.7B | 100.9 |
| Oct 20 | 42.5B | 99.6 | 9.7B | 100.9 |
| Oct 21 | 42.8B | 100.2 | 9.7B | 100.9 |
| Oct 22 | 42.1B | 98.8 | 9.8B | 101.5 |
| Oct 23 | 42B | 98.4 | 9.8B | 101.4 |
| Oct 26 | 42.4B | 99.4 | 9.8B | 101.6 |
| Oct 27 | 42.7B | 100.0 | 9.8B | 101.7 |
| Oct 28 | 42.9B | 100.5 | 9.8B | 101.7 |
| Oct 29 | 42.6B | 100.0 | 9.8B | 101.9 |
| Oct 30 | 41.8B | 98.0 | 9.9B | 102.2 |
Active funds took about 3% of the week's net inflows
Active funds took in $234 million, down from $325 million the prior week, while index funds took in $7.31 billion, according to iShares data. The 21 active funds have had net inflows in each of the four weeks shown, $1.12 billion in total. Their share of net flow was about 3% in each of the last two weeks, so they kept taking money without gaining share.
Chart 5
Weekly net flows, active vs index funds
- Active
- Index
Show as table
| Label | Active | Index | Total |
|---|---|---|---|
| Oct 11 | $310.1M | −$289.6T | −$289.6T |
| Oct 18 | $256.2M | $14.8B | $15B |
| Oct 25 | $324.6M | $9.5B | $9.8B |
| Nov 1 | $233.7M | $7.3B | $7.5B |
Five funds accounted for more than 70% of outflows
The five largest outflows totaled $6.10 billion, more than 70% of the week's $8.64 billion in gross outflows, according to iShares data. The five largest inflows totaled $6.40 billion, about 40% of $16.19 billion in gross inflows. Money came in across 287 funds and left mostly from a handful.
Within the inflows, size mattered. HYG's $1.05 billion was about 6% of its $17.7 billion in assets on Oct. 30, while IVV's $1.40 billion was about 0.16% of its $870 billion.
Bond flows were mixed. IEF took in $1.19 billion, but TLT lost $259 million and IGOV $303 million, leaving the Treasuries category at -$803 million, iShares data show. Among the five largest inflows, SOXX, the semiconductor ETF, took in $1.06 billion, a sector position rather than core equity.
Chart 6
Largest fund inflows and outflows, week to Nov 1
- Above zero
- Below zero
- LQD+$1.7B
- IVV+$1.4B
- IEF+$1.2B
- SOXX+$1.1B
- HYG+$1.1B
- IGOV−$303M
- IWS−$841.2M
- EWZ−$1.1B
- IWD−$1.7B
- SHV−$2.1B
Show as table
| Label | Value ($) |
|---|---|
| LQD | +$1.7B |
| IVV | +$1.4B |
| IEF | +$1.2B |
| SOXX | +$1.1B |
| HYG | +$1.1B |
| SHV | −$2.1B |
| IWD | −$1.7B |
| EWZ | −$1.1B |
| IWS | −$841.2M |
| IGOV | −$303M |
Table 2
Largest inflows and outflows, week to Nov 1
| Ticker↕ | Fund↑ | Category↕ | Net flow↕ | Assets↕ | 4 weeks |
|---|---|---|---|---|---|
| IEF | iShares 7-10 Year Treasury Bond ETF | Treasuries | ▲+$1.2B | $43.5B | |
| TLT | iShares 20+ Year Treasury Bond ETF | Treasuries | ▼−$259M | $47.5B | |
| USHY | iShares Broad USD High Yield Corporate Bond ETF | Corporate & high yield | ▲+$738M | $26.7B | |
| ICVT | iShares Convertible Bond ETF | Broad bonds | ▼−$193M | $7.4B | |
| IVV | iShares Core S&P 500 ETF | US large cap & broad market | ▲+$1.4B | $870B | |
| IJR | iShares Core S&P Small-Cap ETF | Small & mid cap | ▲+$576M | $106B | |
| HYG | iShares iBoxx $ High Yield Corporate Bond ETF | Corporate & high yield | ▲+$1.1B | $17.7B | |
| LQD | iShares iBoxx $ Investment Grade Corporate Bond ETF | Corporate & high yield | ▲+$1.7B | $32B | |
| IGOV | iShares International Treasury Bond ETF | Treasuries | ▼−$303M | $1B | |
| EWZ | iShares MSCI Brazil ETF | Other equity | ▼−$1.1B | $9.6B | |
| IWD | iShares Russell 1000 Value ETF | Factor & style | ▼−$1.7B | $83.2B | |
| IWR | iShares Russell Mid-Cap ETF | Small & mid cap | ▲+$783M | $58.1B | |
| IWS | iShares Russell Mid-Cap Value ETF | Factor & style | ▼−$841M | $14.9B | |
| IJT | iShares S&P Small-Cap 600 Growth ETF | Factor & style | ▼−$221M | $7.5B | |
| SOXX | iShares Semiconductor ETF | Sector & thematic | ▲+$1.1B | $43.7B | |
| SHV | iShares Short Treasury Bond ETF | Treasuries | ▼−$2.1B | $21.4B |
1–16 of 16
Source: iShares (BlackRock) published daily NAV and shares outstanding; flow = change in shares outstanding x NAV
IWD and IWS turned to outflows as IVV and HYG turned to inflows
IWD, the iShares Russell 1000 Value ETF, lost $1.72 billion after averaging $146 million a week of inflows over the prior three weeks, according to iShares data. Its prior weeks were +$129 million, +$38 million and +$271 million. IWS, the Russell Mid-Cap Value ETF, lost $841 million after averaging $19 million a week of inflows.
Four funds flipped from outflows to inflows. IVV went from a three-week average outflow of $1.26 billion to a $1.40 billion inflow, iShares data show. HYG went from an average outflow of $420 million to a $1.05 billion inflow, IEF from $117 million to $1.19 billion, and IJR from $112 million to $576 million. In the Russell mid-cap family, IWR, the broad fund, took in $783 million in the week IWS lost $841 million.
The data support a move from value tilts toward broad index exposure, but one week is a thin base. IJT, the small-cap growth fund, also lost $221 million, so the outflows were not confined to value. IWD's next weekly flow will show whether its reversal persists, set against assets of $83.2 billion on Oct. 30.
Chart 7
Reversals: prior three-week average vs this week
Show as table
| Item | 3-week avg | This week | Change |
|---|---|---|---|
| IWD | $145.9M | −$1.7B | −$1.9B |
| IVV | −$1.3B | $1.4B | +$2.7B |
| IEF | −$117.1M | $1.2B | +$1.3B |
| HYG | −$420M | $1.1B | +$1.5B |
| IWS | $19.4M | −$841.2M | −$860.6M |
| IJR | −$112.5M | $576.4M | +$688.9M |
PWD Intelligence
The ETF Flow Report
New editions publish on a fixed schedule. Follow the series to see each one on My Desk.
Free. Every morning. Unsubscribe from any edition in one click.
From other sections
- ETF DailyInvesco's QQQM drew $27 billion as 0.10% Nasdaq-100 rivals launched
- ETF DailyGlobal ETF flows passed $1 trillion for the year as VOO and IVV diverged
- ETF DailyAll 20 largest ETF issuers posted net inflows in September; VOO lost $13.3bn
- Features19 RIA deals in a week as Mariner seeks $150 million in debt