PWD IntelligenceThe ETF Flow ReportWeek of Oct 26
Net flows, the week
$9.8B
down $5.3BChange vs the prior week
Source for Net flows, the week
Source: iShares (BlackRock) published daily NAV and shares outstanding; flow = change in shares outstanding x NAViShares funds take in $9.8 billion as SOXX alone adds $5.3 billion
IWM, IVV and IGV, which drew money over the prior three weeks, all had outflows in the week to Oct. 25, iShares data show.
Share
By PWD Intelligence28 min readMethodology
Gross inflows
$21.4B
249 funds took in money
Source for Gross inflows
Source: iShares (BlackRock) published daily NAV and shares outstanding; flow = change in shares outstanding x NAVGross outflows
−$11.6B
181 funds lost money
Source for Gross outflows
Source: iShares (BlackRock) published daily NAV and shares outstanding; flow = change in shares outstanding x NAVTop five funds' share of inflows
51.7%
SOXX, MUB, EMXC, LQD, SGOV
Source for Top five funds' share of inflows
Source: iShares (BlackRock) published daily NAV and shares outstanding; flow = change in shares outstanding x NAVFunds covered
433
Issuers: iShares (BlackRock)
Source for Funds covered
Source: iShares (BlackRock) published daily NAV and shares outstanding; flow = change in shares outstanding x NAVWhat matters
- iShares funds took in a net $9.78 billion in the week to Oct 25, according to iShares' published daily fund data, and the iShares Semiconductor ETF (SOXX) alone supplied $5.34 billion of it.
- SOXX, MUB, EMXC, LQD and SGOV together took in $11.04 billion in the week to Oct 25, just over half of the $21.37 billion gross inflow, according to iShares' published daily fund data.
- IWM, IVV and IGV, which together took in $6.02 billion over the prior three weeks, lost a combined $5.55 billion in the week to Oct 25, according to iShares' published daily fund data.
Chart 1
Net ETF flows by category, week to Oct 25
Inflows above zero, outflows below; issuer-reported funds only
- Above zero
- Below zero
- Sector & thematic+$3.7B
- Municipal bonds+$3B
- International & emerging+$2B
- Corporate & high yield+$2B
- Treasuries+$1.3B
- Broad bonds+$771.9M
- Crypto+$630.2M
- Factor & style+$515.6M
- US large cap & broad market−$1.4B
- Small & mid cap−$2.4B
Show as table
| Label | Value ($) |
|---|---|
| Sector & thematic | +$3.7B |
| Municipal bonds | +$3B |
| Small & mid cap | −$2.4B |
| International & emerging | +$2B |
| Corporate & high yield | +$2B |
| US large cap & broad market | −$1.4B |
| Treasuries | +$1.3B |
| Broad bonds | +$771.9M |
| Crypto | +$630.2M |
| Factor & style | +$515.6M |
Chart 2
SOXX alone drew $5.3B; IWM and IVV each shed more than $2B
Net flows by fund, week to Oct 25
- Above zero
- Below zero
- SOXX+$5.3B
- MUB+$2.3B
- EMXC+$1.4B
- LQD+$1.3B
- IGV−$1.1B
- IVV−$2B
- IWM−$2.5B
Show as table
| Item | Value ($) |
|---|---|
| SOXX | $5.3B |
| MUB | $2.3B |
| EMXC | $1.4B |
| LQD | $1.3B |
| IGV | −$1.1B |
| IVV | −$2B |
| IWM | −$2.5B |
Chart 3
SOXX alone drew $5.3B; IWM and IVV each shed more than $2B
Net flows by fund, week to Oct 25
- Above zero
- Below zero
- SOXX+$5.3B
- MUB+$2.3B
- EMXC+$1.4B
- LQD+$1.3B
- IGV−$1.1B
- IVV−$2B
- IWM−$2.5B
Show as table
| Item | Value ($) |
|---|---|
| SOXX | $5.3B |
| MUB | $2.3B |
| EMXC | $1.4B |
| LQD | $1.3B |
| IGV | −$1.1B |
| IVV | −$2B |
| IWM | −$2.5B |
Chart 4
Sector and muni funds drew money; small- and mid-cap funds lost it
Net flows by category, week to Oct 25
- Inflow / above zero
- Outflow / below zero
Show as table
| Label | Value ($) |
|---|---|
| Sector & thematic | $3.7B |
| Municipal bonds | $3B |
| International & emerging | $2B |
| Corporate & high yield | $2B |
| Treasuries | $1.3B |
| Broad bonds | $771.9M |
| Crypto | $630.2M |
| Factor & style | $515.6M |
| US large cap & broad market | −$1.4B |
| Small & mid cap | −$2.4B |
Chart 5
SOXX alone drew $5.3B; IWM and IVV each shed more than $2B
Net flows by fund, week to Oct 25
- Above zero
- Below zero
- SOXX+$5.3B
- MUB+$2.3B
- EMXC+$1.4B
- LQD+$1.3B
- IGV−$1.1B
- IVV−$2B
- IWM−$2.5B
Show as table
| Item | Value ($) |
|---|---|
| SOXX | $5.3B |
| MUB | $2.3B |
| EMXC | $1.4B |
| LQD | $1.3B |
| IGV | −$1.1B |
| IVV | −$2B |
| IWM | −$2.5B |
Chart 6
SOXX alone took in $5.3B; IWM and IVV each shed more than $2B
Net flows by fund, week to Oct 25
- Above zero
- Below zero
- SOXX+$5.3B
- MUB+$2.3B
- EMXC+$1.4B
- LQD+$1.3B
- IGV−$1.1B
- IVV−$2B
- IWM−$2.5B
Show as table
| Item | Value ($) |
|---|---|
| SOXX | $5.3B |
| MUB | $2.3B |
| EMXC | $1.4B |
| LQD | $1.3B |
| IGV | −$1.1B |
| IVV | −$2B |
| IWM | −$2.5B |
Chart 7
Sector and muni funds drew money; small- and mid-cap funds lost it
Net flows by category, week to Oct 25
- Above zero
- Below zero
- Sector & thematic+$3.7B
- Municipal bonds+$3B
- International & emerging+$2B
- Corporate & high yield+$2B
- Treasuries+$1.3B
- Broad bonds+$771.9M
- Crypto+$630.2M
- Factor & style+$515.6M
- US large cap & broad market−$1.4B
- Small & mid cap−$2.4B
Show as table
| Label | Value ($) |
|---|---|
| Sector & thematic | +$3.7B |
| Municipal bonds | +$3B |
| International & emerging | +$2B |
| Corporate & high yield | +$2B |
| Treasuries | +$1.3B |
| Broad bonds | +$771.9M |
| Crypto | +$630.2M |
| Factor & style | +$515.6M |
| US large cap & broad market | −$1.4B |
| Small & mid cap | −$2.4B |
Chart 8
SOXX alone took in $5.3B; IWM and IVV each lost more than $2B
Net flows by fund, week to Oct 25
- Above zero
- Below zero
- SOXX+$5.3B
- MUB+$2.3B
- EMXC+$1.4B
- LQD+$1.3B
- IGV−$1.1B
- IVV−$2B
- IWM−$2.5B
Show as table
| Item | Value ($) |
|---|---|
| SOXX | $5.3B |
| MUB | $2.3B |
| EMXC | $1.4B |
| LQD | $1.3B |
| IGV | −$1.1B |
| IVV | −$2B |
| IWM | −$2.5B |
Chart 9
SOXX drew $5.3B; IWM and IVV each lost more than $2B
Net flows by fund, week to Oct 25
- Above zero
- Below zero
- SOXX+$5.3B
- MUB+$2.3B
- EMXC+$1.4B
- LQD+$1.3B
- IGV−$1.1B
- IVV−$2B
- IWM−$2.5B
Show as table
| Item | Value ($) |
|---|---|
| SOXX | $5.3B |
| MUB | $2.3B |
| EMXC | $1.4B |
| LQD | $1.3B |
| IGV | −$1.1B |
| IVV | −$2B |
| IWM | −$2.5B |
Chart 10
SOXX drew $5.3B; IWM and IVV each lost more than $2B
Net flows by fund, week to Oct 25
- Above zero
- Below zero
- SOXX+$5.3B
- MUB+$2.3B
- EMXC+$1.4B
- LQD+$1.3B
- IGV−$1.1B
- IVV−$2B
- IWM−$2.5B
Show as table
| Item | Value ($) |
|---|---|
| SOXX | $5.3B |
| MUB | $2.3B |
| EMXC | $1.4B |
| LQD | $1.3B |
| IGV | −$1.1B |
| IVV | −$2B |
| IWM | −$2.5B |
Chart 11
Sector and muni funds drew money; small- and mid-cap funds lost it
Net flows by category, week to Oct 25
- Above zero
- Below zero
- Sector & thematic+$3.7B
- Municipal bonds+$3B
- International & emerging+$2B
- Corporate & high yield+$2B
- Treasuries+$1.3B
- Broad bonds+$771.9M
- Crypto+$630.2M
- Factor & style+$515.6M
- US large cap & broad market−$1.4B
- Small & mid cap−$2.4B
Show as table
| Label | Value ($) |
|---|---|
| Sector & thematic | +$3.7B |
| Municipal bonds | +$3B |
| International & emerging | +$2B |
| Corporate & high yield | +$2B |
| Treasuries | +$1.3B |
| Broad bonds | +$771.9M |
| Crypto | +$630.2M |
| Factor & style | +$515.6M |
| US large cap & broad market | −$1.4B |
| Small & mid cap | −$2.4B |
Chart 12
Sector and muni funds gained; small- and mid-cap funds lost
Net flows by category, week to Oct 25
- Above zero
- Below zero
- Sector & thematic+$3.7B
- Municipal bonds+$3B
- International & emerging+$2B
- Corporate & high yield+$2B
- Treasuries+$1.3B
- Broad bonds+$771.9M
- Crypto+$630.2M
- Factor & style+$515.6M
- US large cap & broad market−$1.4B
- Small & mid cap−$2.4B
Show as table
| Label | Value ($) |
|---|---|
| Sector & thematic | +$3.7B |
| Municipal bonds | +$3B |
| International & emerging | +$2B |
| Corporate & high yield | +$2B |
| Treasuries | +$1.3B |
| Broad bonds | +$771.9M |
| Crypto | +$630.2M |
| Factor & style | +$515.6M |
| US large cap & broad market | −$1.4B |
| Small & mid cap | −$2.4B |
Chart 13
Sector and muni funds drew money; small- and mid-cap funds lost it
Net flows by category, week to Oct 25, in dollars
- Above zero
- Below zero
- Sector & thematic+$3.7B
- Municipal bonds+$3B
- International & emerging+$2B
- Corporate & high yield+$2B
- Treasuries+$1.3B
- Broad bonds+$771.9M
- Crypto+$630.2M
- Factor & style+$515.6M
- US large cap & broad market−$1.4B
- Small & mid cap−$2.4B
Show as table
| Label | Value ($) |
|---|---|
| Sector & thematic | +$3.7B |
| Municipal bonds | +$3B |
| International & emerging | +$2B |
| Corporate & high yield | +$2B |
| Treasuries | +$1.3B |
| Broad bonds | +$771.9M |
| Crypto | +$630.2M |
| Factor & style | +$515.6M |
| US large cap & broad market | −$1.4B |
| Small & mid cap | −$2.4B |
Chart 14
SOXX drew $5.3B; IWM and IVV each lost more than $2B
Net flows by fund, week to Oct 25
- Above zero
- Below zero
- SOXX+$5.3B
- MUB+$2.3B
- EMXC+$1.4B
- LQD+$1.3B
- IGV−$1.1B
- IVV−$2B
- IWM−$2.5B
Show as table
| Item | Value ($) |
|---|---|
| SOXX | $5.3B |
| MUB | $2.3B |
| EMXC | $1.4B |
| LQD | $1.3B |
| IGV | −$1.1B |
| IVV | −$2B |
| IWM | −$2.5B |
Chart 15
SOXX drew $5.3 billion; IWM and IVV each lost more than $2 billion
Net flows by fund, week to Oct 25
- Above zero
- Below zero
- SOXX+$5.3B
- MUB+$2.3B
- EMXC+$1.4B
- LQD+$1.3B
- IGV−$1.1B
- IVV−$2B
- IWM−$2.5B
Show as table
| Item | Value ($) |
|---|---|
| SOXX | $5.3B |
| MUB | $2.3B |
| EMXC | $1.4B |
| LQD | $1.3B |
| IGV | −$1.1B |
| IVV | −$2B |
| IWM | −$2.5B |
Chart 16
Sector and muni funds drew money; small- and mid-cap funds lost it
Net flows by category, week to Oct 25, in dollars
- Above zero
- Below zero
- Sector & thematic+$3.7B
- Municipal bonds+$3B
- International & emerging+$2B
- Corporate & high yield+$2B
- Treasuries+$1.3B
- Broad bonds+$771.9M
- Crypto+$630.2M
- Factor & style+$515.6M
- US large cap & broad market−$1.4B
- Small & mid cap−$2.4B
Show as table
| Label | Value ($) |
|---|---|
| Sector & thematic | +$3.7B |
| Municipal bonds | +$3B |
| International & emerging | +$2B |
| Corporate & high yield | +$2B |
| Treasuries | +$1.3B |
| Broad bonds | +$771.9M |
| Crypto | +$630.2M |
| Factor & style | +$515.6M |
| US large cap & broad market | −$1.4B |
| Small & mid cap | −$2.4B |
Chart 17
Sector and muni funds gained; small- and mid-cap funds bled
Net flows by category, week to Oct 25, in dollars
- Above zero
- Below zero
- Sector & thematic+$3.7B
- Municipal bonds+$3B
- International & emerging+$2B
- Corporate & high yield+$2B
- Treasuries+$1.3B
- Broad bonds+$771.9M
- Crypto+$630.2M
- Factor & style+$515.6M
- US large cap & broad market−$1.4B
- Small & mid cap−$2.4B
Show as table
| Label | Value ($) |
|---|---|
| Sector & thematic | +$3.7B |
| Municipal bonds | +$3B |
| International & emerging | +$2B |
| Corporate & high yield | +$2B |
| Treasuries | +$1.3B |
| Broad bonds | +$771.9M |
| Crypto | +$630.2M |
| Factor & style | +$515.6M |
| US large cap & broad market | −$1.4B |
| Small & mid cap | −$2.4B |
Chart 18
SOXX drew $5.3 billion; IWM and IVV each lost more than $2 billion
Net flows by fund, week to Oct 25
- Above zero
- Below zero
- SOXX+$5.3B
- MUB+$2.3B
- EMXC+$1.4B
- LQD+$1.3B
- IGV−$1.1B
- IVV−$2B
- IWM−$2.5B
Show as table
| Item | Value ($) |
|---|---|
| SOXX | $5.3B |
| MUB | $2.3B |
| EMXC | $1.4B |
| LQD | $1.3B |
| IGV | −$1.1B |
| IVV | −$2B |
| IWM | −$2.5B |
Chart 19
Sector and muni funds drew money; small- and mid-cap funds lost it
Net flows by category, week to Oct 25, in dollars
- Above zero
- Below zero
- Sector & thematic+$3.7B
- Municipal bonds+$3B
- International & emerging+$2B
- Corporate & high yield+$2B
- Treasuries+$1.3B
- Broad bonds+$771.9M
- Crypto+$630.2M
- Factor & style+$515.6M
- US large cap & broad market−$1.4B
- Small & mid cap−$2.4B
Show as table
| Label | Value ($) |
|---|---|
| Sector & thematic | +$3.7B |
| Municipal bonds | +$3B |
| International & emerging | +$2B |
| Corporate & high yield | +$2B |
| Treasuries | +$1.3B |
| Broad bonds | +$771.9M |
| Crypto | +$630.2M |
| Factor & style | +$515.6M |
| US large cap & broad market | −$1.4B |
| Small & mid cap | −$2.4B |
Chart 20
SOXX drew $5.3 billion; IWM and IVV each lost more than $2 billion
Net flows by fund, week to Oct 25
- Above zero
- Below zero
- SOXX+$5.3B
- MUB+$2.3B
- EMXC+$1.4B
- LQD+$1.3B
- IGV−$1.1B
- IVV−$2B
- IWM−$2.5B
Show as table
| Item | Value ($) |
|---|---|
| SOXX | $5.3B |
| MUB | $2.3B |
| EMXC | $1.4B |
| LQD | $1.3B |
| IGV | −$1.1B |
| IVV | −$2B |
| IWM | −$2.5B |
Chart 21
SOXX pulled in $5.3 billion; IWM and IVV each shed more than $2 billion
Net flows by fund, week to Oct 25
- Above zero
- Below zero
- SOXX+$5.3B
- MUB+$2.3B
- EMXC+$1.4B
- LQD+$1.3B
- IGV−$1.1B
- IVV−$2B
- IWM−$2.5B
Show as table
| Item | Value ($) |
|---|---|
| SOXX | $5.3B |
| MUB | $2.3B |
| EMXC | $1.4B |
| LQD | $1.3B |
| IGV | −$1.1B |
| IVV | −$2B |
| IWM | −$2.5B |
Chart 22
Sector and muni funds drew money; small- and mid-cap funds lost it
Net flows by category, week to Oct 25, in dollars
- Above zero
- Below zero
- Sector & thematic+$3.7B
- Municipal bonds+$3B
- International & emerging+$2B
- Corporate & high yield+$2B
- Treasuries+$1.3B
- Broad bonds+$771.9M
- Crypto+$630.2M
- Factor & style+$515.6M
- US large cap & broad market−$1.4B
- Small & mid cap−$2.4B
Show as table
| Label | Value ($) |
|---|---|
| Sector & thematic | +$3.7B |
| Municipal bonds | +$3B |
| International & emerging | +$2B |
| Corporate & high yield | +$2B |
| Treasuries | +$1.3B |
| Broad bonds | +$771.9M |
| Crypto | +$630.2M |
| Factor & style | +$515.6M |
| US large cap & broad market | −$1.4B |
| Small & mid cap | −$2.4B |
Chart 23
Sector and muni funds drew money; small- and mid-cap funds lost it
Net flows by category, week to Oct 25, in dollars
- Above zero
- Below zero
- Sector & thematic+$3.7B
- Municipal bonds+$3B
- International & emerging+$2B
- Corporate & high yield+$2B
- Treasuries+$1.3B
- Broad bonds+$771.9M
- Crypto+$630.2M
- Factor & style+$515.6M
- US large cap & broad market−$1.4B
- Small & mid cap−$2.4B
Show as table
| Label | Value ($) |
|---|---|
| Sector & thematic | +$3.7B |
| Municipal bonds | +$3B |
| International & emerging | +$2B |
| Corporate & high yield | +$2B |
| Treasuries | +$1.3B |
| Broad bonds | +$771.9M |
| Crypto | +$630.2M |
| Factor & style | +$515.6M |
| US large cap & broad market | −$1.4B |
| Small & mid cap | −$2.4B |
Chart 24
Sector and muni funds drew money; small- and mid-cap funds lost it
Net flows by category, week to Oct 25, in dollars
- Above zero
- Below zero
- Sector & thematic+$3.7B
- Municipal bonds+$3B
- International & emerging+$2B
- Corporate & high yield+$2B
- Treasuries+$1.3B
- Broad bonds+$771.9M
- Crypto+$630.2M
- Factor & style+$515.6M
- US large cap & broad market−$1.4B
- Small & mid cap−$2.4B
Show as table
| Label | Value ($) |
|---|---|
| Sector & thematic | +$3.7B |
| Municipal bonds | +$3B |
| International & emerging | +$2B |
| Corporate & high yield | +$2B |
| Treasuries | +$1.3B |
| Broad bonds | +$771.9M |
| Crypto | +$630.2M |
| Factor & style | +$515.6M |
| US large cap & broad market | −$1.4B |
| Small & mid cap | −$2.4B |
Chart 25
Sector and muni funds drew money; small-cap funds lost it
Net flows by category, week to Oct 25, in dollars
- Above zero
- Below zero
- Sector & thematic+$3.7B
- Municipal bonds+$3B
- International & emerging+$2B
- Corporate & high yield+$2B
- Treasuries+$1.3B
- Broad bonds+$771.9M
- Crypto+$630.2M
- Factor & style+$515.6M
- US large cap & broad market−$1.4B
- Small & mid cap−$2.4B
Show as table
| Item | Value ($) |
|---|---|
| Sector & thematic | $3.7B |
| Municipal bonds | $3B |
| International & emerging | $2B |
| Corporate & high yield | $2B |
| Treasuries | $1.3B |
| Broad bonds | $771.9M |
| Crypto | $630.2M |
| Factor & style | $515.6M |
| US large cap & broad market | −$1.4B |
| Small & mid cap | −$2.4B |
Chart 26
Sector and muni funds drew money; small-cap and broad-market funds lost it
Net flows by category, week to Oct 25, in dollars
- Above zero
- Below zero
- Sector & thematic+$3.7B
- Municipal bonds+$3B
- International & emerging+$2B
- Corporate & high yield+$2B
- Treasuries+$1.3B
- Broad bonds+$771.9M
- Crypto+$630.2M
- Factor & style+$515.6M
- US large cap & broad market−$1.4B
- Small & mid cap−$2.4B
Show as table
| Item | Value ($) |
|---|---|
| Sector & thematic | $3.7B |
| Municipal bonds | $3B |
| International & emerging | $2B |
| Corporate & high yield | $2B |
| Treasuries | $1.3B |
| Broad bonds | $771.9M |
| Crypto | $630.2M |
| Factor & style | $515.6M |
| US large cap & broad market | −$1.4B |
| Small & mid cap | −$2.4B |
Chart 27
Sector and muni funds drew money; small-cap and broad-market funds lost it
Net flows by category, week to Oct 25, in dollars
- Above zero
- Below zero
- Sector & thematic+$3.7B
- Municipal bonds+$3B
- International & emerging+$2B
- Corporate & high yield+$2B
- Treasuries+$1.3B
- Broad bonds+$771.9M
- Crypto+$630.2M
- Factor & style+$515.6M
- US large cap & broad market−$1.4B
- Small & mid cap−$2.4B
Show as table
| Label | Value ($) |
|---|---|
| Sector & thematic | +$3.7B |
| Municipal bonds | +$3B |
| International & emerging | +$2B |
| Corporate & high yield | +$2B |
| Treasuries | +$1.3B |
| Broad bonds | +$771.9M |
| Crypto | +$630.2M |
| Factor & style | +$515.6M |
| US large cap & broad market | −$1.4B |
| Small & mid cap | −$2.4B |
SOXX supplied more than half of the $9.78 billion net inflow
Chart 28
SOXX drew $5.3 billion, more than the next three funds combined
Largest inflows and outflows among iShares funds, week to Oct 25
- Above zero
- Below zero
- SOXX+$5.3B
- MUB+$2.3B
- EMXC+$1.4B
- LQD+$1.3B
- IGV−$1.1B
- IVV−$2B
- IWM−$2.5B
Show as table
| Item | Value ($) |
|---|---|
| SOXX | $5.3B |
| MUB | $2.3B |
| EMXC | $1.4B |
| LQD | $1.3B |
| IGV | −$1.1B |
| IVV | −$2B |
| IWM | −$2.5B |
Chart 29
SOXX drew $5.3 billion, more than the next three funds combined
Largest inflows and outflows among iShares funds, week to Oct 25
- Above zero
- Below zero
- SOXX+$5.3B
- MUB+$2.3B
- EMXC+$1.4B
- LQD+$1.3B
- IGV−$1.1B
- IVV−$2B
- IWM−$2.5B
Show as table
| Item | Value ($) |
|---|---|
| SOXX | $5.3B |
| MUB | $2.3B |
| EMXC | $1.4B |
| LQD | $1.3B |
| IGV | −$1.1B |
| IVV | −$2B |
| IWM | −$2.5B |
Chart 30
SOXX drew $5.3 billion, more than the next three funds combined
Largest inflows and outflows among iShares funds, week to Oct 25
- Above zero
- Below zero
- SOXX+$5.3B
- MUB+$2.3B
- EMXC+$1.4B
- LQD+$1.3B
- IGV−$1.1B
- IVV−$2B
- IWM−$2.5B
Show as table
| Item | Value ($) |
|---|---|
| SOXX | $5.3B |
| MUB | $2.3B |
| EMXC | $1.4B |
| LQD | $1.3B |
| IGV | −$1.1B |
| IVV | −$2B |
| IWM | −$2.5B |
Chart 31
SOXX's $5.3 billion topped the next three funds combined
Largest inflows and outflows among iShares funds, week to Oct 25
- Above zero
- Below zero
- SOXX+$5.3B
- MUB+$2.3B
- EMXC+$1.4B
- LQD+$1.3B
- IGV−$1.1B
- IVV−$2B
- IWM−$2.5B
Show as table
| Item | Value ($) |
|---|---|
| SOXX | $5.3B |
| MUB | $2.3B |
| EMXC | $1.4B |
| LQD | $1.3B |
| IGV | −$1.1B |
| IVV | −$2B |
| IWM | −$2.5B |
Chart 32
SOXX's $5.3 billion topped the next three funds combined
Largest inflows and outflows among iShares funds, week to Oct 25
- Above zero
- Below zero
- SOXX+$5.3B
- MUB+$2.3B
- EMXC+$1.4B
- LQD+$1.3B
- IGV−$1.1B
- IVV−$2B
- IWM−$2.5B
Show as table
| Item | Value ($) |
|---|---|
| SOXX | $5.3B |
| MUB | $2.3B |
| EMXC | $1.4B |
| LQD | $1.3B |
| IGV | −$1.1B |
| IVV | −$2B |
| IWM | −$2.5B |
Chart 33
SOXX's $5.3 billion topped the next three funds combined
Largest inflows and outflows among iShares funds, week to Oct 25
- Above zero
- Below zero
- SOXX+$5.3B
- MUB+$2.3B
- EMXC+$1.4B
- LQD+$1.3B
- IGV−$1.1B
- IVV−$2B
- IWM−$2.5B
Show as table
| Item | Value ($) |
|---|---|
| SOXX | $5.3B |
| MUB | $2.3B |
| EMXC | $1.4B |
| LQD | $1.3B |
| IGV | −$1.1B |
| IVV | −$2B |
| IWM | −$2.5B |
Chart 34
SOXX's $5.3 billion topped the next three funds combined
Largest inflows and outflows among iShares funds, week to Oct 25
- Above zero
- Below zero
- SOXX+$5.3B
- MUB+$2.3B
- EMXC+$1.4B
- LQD+$1.3B
- IGV−$1.1B
- IVV−$2B
- IWM−$2.5B
Show as table
| Item | Value ($) |
|---|---|
| SOXX | $5.3B |
| MUB | $2.3B |
| EMXC | $1.4B |
| LQD | $1.3B |
| IGV | −$1.1B |
| IVV | −$2B |
| IWM | −$2.5B |
Chart 35
SOXX's $5.3 billion topped the next three funds combined
Largest inflows and outflows among iShares funds, week to Oct 25
- Above zero
- Below zero
- SOXX+$5.3B
- MUB+$2.3B
- EMXC+$1.4B
- LQD+$1.3B
- IGV−$1.1B
- IVV−$2B
- IWM−$2.5B
Show as table
| Item | Value ($) |
|---|---|
| SOXX | $5.3B |
| MUB | $2.3B |
| EMXC | $1.4B |
| LQD | $1.3B |
| IGV | −$1.1B |
| IVV | −$2B |
| IWM | −$2.5B |
Chart 36
SOXX's $5.3 billion inflow exceeded the next three funds combined
Largest inflows and outflows among iShares funds, week to Oct 25
- Above zero
- Below zero
- SOXX+$5.3B
- MUB+$2.3B
- EMXC+$1.4B
- LQD+$1.3B
- IGV−$1.1B
- IVV−$2B
- IWM−$2.5B
Show as table
| Item | Value ($) |
|---|---|
| SOXX | $5.3B |
| MUB | $2.3B |
| EMXC | $1.4B |
| LQD | $1.3B |
| IGV | −$1.1B |
| IVV | −$2B |
| IWM | −$2.5B |
Chart 37
SOXX's $5.3 billion topped the next three funds combined
Largest inflows and outflows among iShares funds, week to Oct. 25
- Above zero
- Below zero
- SOXX+$5.3B
- MUB+$2.3B
- EMXC+$1.4B
- LQD+$1.3B
- IGV−$1.1B
- IVV−$2B
- IWM−$2.5B
Show as table
| Item | Value ($) |
|---|---|
| SOXX | $5.3B |
| MUB | $2.3B |
| EMXC | $1.4B |
| LQD | $1.3B |
| IGV | −$1.1B |
| IVV | −$2B |
| IWM | −$2.5B |
Chart 38
SOXX's $5.3 billion topped the next three funds combined
Largest inflows and outflows among iShares funds, week to Oct 25
- Above zero
- Below zero
- SOXX+$5.3B
- MUB+$2.3B
- EMXC+$1.4B
- LQD+$1.3B
- IGV−$1.1B
- IVV−$2B
- IWM−$2.5B
Show as table
| Item | Value ($) |
|---|---|
| SOXX | $5.3B |
| MUB | $2.3B |
| EMXC | $1.4B |
| LQD | $1.3B |
| IGV | −$1.1B |
| IVV | −$2B |
| IWM | −$2.5B |
Chart 39
SOXX's $5.3B topped the next three funds combined
Largest inflows and outflows among iShares funds, week to Oct 25
- Above zero
- Below zero
- SOXX+$5.3B
- MUB+$2.3B
- EMXC+$1.4B
- LQD+$1.3B
- IGV−$1.1B
- IVV−$2B
- IWM−$2.5B
Show as table
| Item | Value ($) |
|---|---|
| SOXX | $5.3B |
| MUB | $2.3B |
| EMXC | $1.4B |
| LQD | $1.3B |
| IGV | −$1.1B |
| IVV | −$2B |
| IWM | −$2.5B |
Chart 40
SOXX's $5.3 billion was more than the next three funds combined
Largest inflows and outflows among iShares funds, week to Oct. 25
- Above zero
- Below zero
- SOXX+$5.3B
- MUB+$2.3B
- EMXC+$1.4B
- LQD+$1.3B
- IGV−$1.1B
- IVV−$2B
- IWM−$2.5B
Show as table
| Item | Value ($) |
|---|---|
| SOXX | $5.3B |
| MUB | $2.3B |
| EMXC | $1.4B |
| LQD | $1.3B |
| IGV | −$1.1B |
| IVV | −$2B |
| IWM | −$2.5B |
iShares funds took in a net $9.78 billion in the week to Oct. 25, about two-thirds of the prior week's $15.03 billion, according to iShares' published daily fund data. It was also below the $17.12 billion of the week to Oct. 4.
The iShares Semiconductor ETF (SOXX) alone took in $5.34 billion, more than half the net total. The other funds netted about $4.44 billion. Gross inflows were $21.37 billion and gross outflows $11.59 billion, with 249 funds taking in money and 181 losing it.
SOXX's inflow was roughly an eighth of its $43.2 billion in assets, while IVV's $2.02 billion outflow was about 0.23% of its $873.6 billion. Both asset figures are as of Oct. 23. IWM's $2.46 billion outflow was about 3.3% of its $74.2 billion. IVV's loss is a large dollar figure on a very large fund.
The figures cover only iShares (BlackRock) funds, 433 funds with flow records and $4.46 trillion in assets, not the whole ETF market. The chart below shows the week to Oct. 11 at roughly -$289.6 trillion, more than the covered funds' total assets. That is likely a calculation error in the share-count data, though this is unconfirmed, so that week's total is left out of the comparisons here. The same distortion runs through the four-week totals for equity, index funds and the Other equity category.
Chart 41
SOXX's inflow equaled 12.4% of its assets; IVV's outflow just 0.2%
Weekly net flow as a share of fund assets, three largest movers
- Above zero
- Below zero
- SOXX+12.4%
- IVV−0.2%
- IWM−3.3%
Show as table
| Item | Value (%) |
|---|---|
| SOXX | 12.4% |
| IWM | −3.3% |
| IVV | −0.2% |
Chart 42
SOXX's inflow was 12.4% of its assets; IVV's outflow just 0.2%
Weekly net flow as a share of fund assets, three largest movers
- Above zero
- Below zero
- SOXX+12.4%
- IVV−0.2%
- IWM−3.3%
Show as table
| Item | Value (%) |
|---|---|
| SOXX | 12.4% |
| IWM | −3.3% |
| IVV | −0.2% |
Chart 43
SOXX's inflow was 12.4% of assets; IVV's outflow just 0.2%
Weekly net flow as a share of fund assets, three largest movers
- Above zero
- Below zero
- SOXX+12.4%
- IVV−0.2%
- IWM−3.3%
Show as table
| Item | Value (%) |
|---|---|
| SOXX | 12.4% |
| IWM | −3.3% |
| IVV | −0.2% |
Chart 44
SOXX took in 12.4% of its assets; IVV's outflow was 0.2%
Weekly net flow as a share of fund assets, three largest movers
- Above zero
- Below zero
- SOXX+12.4%
- IVV−0.2%
- IWM−3.3%
Show as table
| Item | Value (%) |
|---|---|
| SOXX | 12.4% |
| IWM | −3.3% |
| IVV | −0.2% |
Chart 45
SOXX's inflow was 12.4% of assets; IVV's outflow just 0.2%
Weekly net flow as a share of fund assets, three largest movers
- Above zero
- Below zero
- SOXX+12.4%
- IVV−0.2%
- IWM−3.3%
Show as table
| Item | Value (%) |
|---|---|
| SOXX | 12.4% |
| IWM | −3.3% |
| IVV | −0.2% |
Chart 46
SOXX's inflow was 12.4% of assets; IVV's outflow just 0.2%
Weekly net flow as a share of fund assets, three largest movers
- Above zero
- Below zero
- SOXX+12.4%
- IVV−0.2%
- IWM−3.3%
Show as table
| Item | Value (%) |
|---|---|
| SOXX | 12.4% |
| IWM | −3.3% |
| IVV | −0.2% |
Chart 47
SOXX's inflow was 12.4% of assets; IVV's outflow just 0.2%
Weekly net flow as a share of fund assets, three largest movers
- Above zero
- Below zero
- SOXX+12.4%
- IVV−0.2%
- IWM−3.3%
Show as table
| Item | Value (%) |
|---|---|
| SOXX | 12.4% |
| IWM | −3.3% |
| IVV | −0.2% |
Chart 48
SOXX's $5.3 billion topped the next three funds combined
Largest inflows and outflows among iShares funds, week to Oct 25
- Above zero
- Below zero
- SOXX+$5.3B
- MUB+$2.3B
- EMXC+$1.4B
- LQD+$1.3B
- IGV−$1.1B
- IVV−$2B
- IWM−$2.5B
Show as table
| Item | Value ($) |
|---|---|
| SOXX | $5.3B |
| MUB | $2.3B |
| EMXC | $1.4B |
| LQD | $1.3B |
| IGV | −$1.1B |
| IVV | −$2B |
| IWM | −$2.5B |
Chart 49
SOXX's $5.3 billion topped the next three funds combined
Largest inflows and outflows among iShares funds, week to Oct 25
- Above zero
- Below zero
- SOXX+$5.3B
- MUB+$2.3B
- EMXC+$1.4B
- LQD+$1.3B
- IGV−$1.1B
- IVV−$2B
- IWM−$2.5B
Show as table
| Item | Value ($) |
|---|---|
| SOXX | $5.3B |
| MUB | $2.3B |
| EMXC | $1.4B |
| LQD | $1.3B |
| IGV | −$1.1B |
| IVV | −$2B |
| IWM | −$2.5B |
Chart 50
SOXX's $5.3 billion topped the next three funds combined
Largest inflows and outflows among iShares funds, week to Oct 25
- Above zero
- Below zero
- SOXX+$5.3B
- MUB+$2.3B
- EMXC+$1.4B
- LQD+$1.3B
- IGV−$1.1B
- IVV−$2B
- IWM−$2.5B
Show as table
| Item | Value ($) |
|---|---|
| SOXX | $5.3B |
| MUB | $2.3B |
| EMXC | $1.4B |
| LQD | $1.3B |
| IGV | −$1.1B |
| IVV | −$2B |
| IWM | −$2.5B |
Chart 51
SOXX's $5.3 billion topped the next three funds combined
Largest inflows and outflows among iShares funds, week to Oct 25
- Above zero
- Below zero
- SOXX+$5.3B
- MUB+$2.3B
- EMXC+$1.4B
- LQD+$1.3B
- IGV−$1.1B
- IVV−$2B
- IWM−$2.5B
Show as table
| Item | Value ($) |
|---|---|
| SOXX | $5.3B |
| MUB | $2.3B |
| EMXC | $1.4B |
| LQD | $1.3B |
| IGV | −$1.1B |
| IVV | −$2B |
| IWM | −$2.5B |
Chart 52
SOXX brought in more than the next three funds combined
Largest inflows and outflows among iShares funds, week to Oct 25
- Above zero
- Below zero
- SOXX+$5.3B
- MUB+$2.3B
- EMXC+$1.4B
- LQD+$1.3B
- IGV−$1.1B
- IVV−$2B
- IWM−$2.5B
Show as table
| Item | Value ($) |
|---|---|
| SOXX | $5.3B |
| MUB | $2.3B |
| EMXC | $1.4B |
| LQD | $1.3B |
| IGV | −$1.1B |
| IVV | −$2B |
| IWM | −$2.5B |
Chart 53
SOXX's $5.3 billion topped the next three funds combined
Largest inflows and outflows among iShares funds, week to Oct 25
- Above zero
- Below zero
- SOXX+$5.3B
- MUB+$2.3B
- EMXC+$1.4B
- LQD+$1.3B
- IGV−$1.1B
- IVV−$2B
- IWM−$2.5B
Show as table
| Item | Value ($) |
|---|---|
| SOXX | $5.3B |
| MUB | $2.3B |
| EMXC | $1.4B |
| LQD | $1.3B |
| IGV | −$1.1B |
| IVV | −$2B |
| IWM | −$2.5B |
Chart 54
SOXX alone topped the next three funds combined
Largest inflows and outflows among iShares funds, week to Oct 25
- Above zero
- Below zero
- SOXX+$5.3B
- MUB+$2.3B
- EMXC+$1.4B
- LQD+$1.3B
- IGV−$1.1B
- IVV−$2B
- IWM−$2.5B
Show as table
| Item | Value ($) |
|---|---|
| SOXX | $5.3B |
| MUB | $2.3B |
| EMXC | $1.4B |
| LQD | $1.3B |
| IGV | −$1.1B |
| IVV | −$2B |
| IWM | −$2.5B |
Chart 55
Net flows by week
Weeks ending on the date shown
- Inflow / above zero
- Outflow / below zero
Show as table
| Label | Value ($) |
|---|---|
| Oct 4 | $17.1B |
| Oct 11 | −$289.6T |
| Oct 18 | $15B |
| Oct 25 | $9.8B |
Four weeks of net flows across every covered fund.
Sector funds, munis and EM drew money; small caps lost $2.36 billion
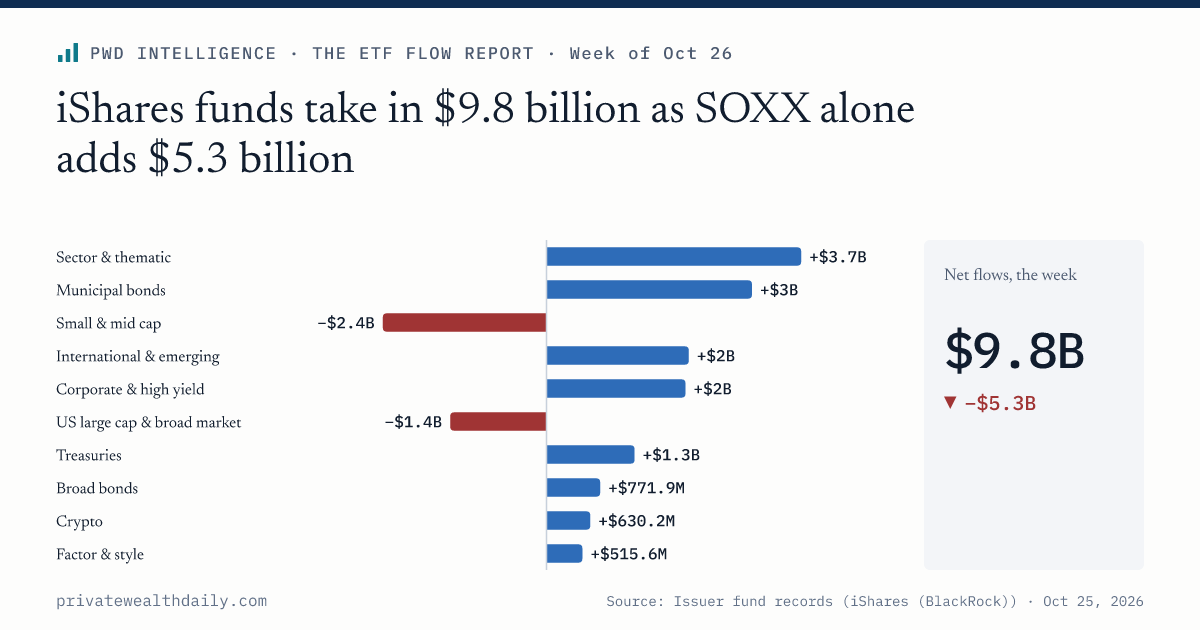
Sector and thematic funds were the week's largest category inflow at $3.67 billion, up from $285 million the prior week. SOXX's $5.34 billion was bigger than the whole category's net figure. IGV, the iShares software ETF, lost $1.07 billion, and the other 24 funds in the category had a combined net outflow of about $607 million.
Municipal bond funds added $2.96 billion, their fourth straight weekly inflow and $8.45 billion over four weeks. MUB supplied $2.30 billion, about 78% of the category. International and emerging funds added $2.05 billion, also positive in each of the four weeks, for $6.81 billion over the period. EMXC, the emerging markets ex-China fund, took in $1.44 billion, and its inflows have risen each week from $159 million in the week to Oct. 4. Corporate and high-yield funds took in $2.00 billion, against $81 million the prior week, with LQD's $1.30 billion inflow outweighing HYG's $590 million outflow. Treasury funds swung to a $1.27 billion inflow from a $2.13 billion outflow.
Small and mid cap funds lost $2.36 billion after taking in $3.31 billion the prior week. US large cap and broad market funds lost $1.39 billion after adding $1.67 billion. Factor and style funds slowed to $516 million from $5.54 billion. Real estate funds lost $378 million, with outflows in each of the four weeks, widening from $13 million in the first week. The pattern suggests money held up in bonds and non-US equity while it left the US index funds that had drawn it the week before. Figures in the table below come from iShares' published daily NAV and shares outstanding, with flow calculated as the change in shares outstanding times NAV.
Chart 56
Sector, muni and EM funds drew money; small caps lost $2.4 billion
Net flows by category, week to Oct 25
- Inflow / above zero
- Outflow / below zero
Show as table
| Label | Value ($) |
|---|---|
| Sector & thematic | $3.7B |
| Municipal bonds | $3B |
| International & emerging | $2B |
| Corporate & high yield | $2B |
| Treasuries | $1.3B |
| Broad bonds | $771.9M |
| Crypto | $630.2M |
| Factor & style | $515.6M |
| US large cap & broad | −$1.4B |
| Small & mid cap | −$2.4B |
Chart 57
Sector funds, munis and EM drew money; small caps and US large cap lost
Net flows by category, week to Oct 25
- Above zero
- Below zero
- Sector & thematic+$3.7B
- Municipal bonds+$3B
- International & emerging+$2B
- Corporate & high yield+$2B
- Treasuries+$1.3B
- Broad bonds+$771.9M
- Crypto+$630.2M
- Factor & style+$515.6M
- US large cap & broad market−$1.4B
- Small & mid cap−$2.4B
Show as table
| Item | Value ($) |
|---|---|
| Sector & thematic | $3.7B |
| Municipal bonds | $3B |
| International & emerging | $2B |
| Corporate & high yield | $2B |
| Treasuries | $1.3B |
| Broad bonds | $771.9M |
| Crypto | $630.2M |
| Factor & style | $515.6M |
| US large cap & broad market | −$1.4B |
| Small & mid cap | −$2.4B |
Chart 58
Sector, muni and EM funds drew money; small-cap and index funds lost it
Net flows by category, week to Oct 25
- Above zero
- Below zero
- Sector & thematic+$3.7B
- Municipal bonds+$3B
- International & emerging+$2B
- Corporate & high yield+$2B
- Treasuries+$1.3B
- Broad bonds+$771.9M
- US large cap & broad market−$1.4B
- Small & mid cap−$2.4B
Show as table
| Item | Value ($) |
|---|---|
| Sector & thematic | $3.7B |
| Municipal bonds | $3B |
| International & emerging | $2B |
| Corporate & high yield | $2B |
| Treasuries | $1.3B |
| Broad bonds | $771.9M |
| US large cap & broad market | −$1.4B |
| Small & mid cap | −$2.4B |
Chart 59
Money moved into bonds and non-US funds; US small and large caps bled
Net flows by category, week to Oct 25
- Inflow / above zero
- Outflow / below zero
Show as table
| Label | Value ($) |
|---|---|
| Sector & thematic | $3.7B |
| Municipal bonds | $3B |
| International & emerging | $2B |
| Corporate & high yield | $2B |
| Treasuries | $1.3B |
| Broad bonds | $771.9M |
| US large cap & broad market | −$1.4B |
| Small & mid cap | −$2.4B |
Table 1
Net flows by category
| Category↕ | This week↓ | Prior week↕ | Four weeks↕ | Funds↕ | 4 weeks |
|---|---|---|---|---|---|
| Sector & thematic | ▲+$3.7B | ▲+$285M | ▲+$2B | 26 | |
| Municipal bonds | ▲+$3B | ▲+$1.8B | ▲+$8.5B | 16 | |
| International & emerging | ▲+$2B | ▲+$1.6B | ▲+$6.8B | 72 | |
| Corporate & high yield | ▲+$2B | ▲+$80.9M | ▲+$5.7B | 49 | |
| Treasuries | ▲+$1.3B | ▼−$2.1B | ▲+$9.5B | 31 | |
| Broad bonds | ▲+$772M | ▼−$185M | ▲+$3.1B | 41 | |
| Crypto | ▲+$630M | ▲+$780M | ▲+$1.9B | 2 | |
| Factor & style | ▲+$516M | ▲+$5.5B | ▲+$6.2B | 41 | |
| Dividend & income | ▲+$251M | ▲+$45.8M | ▲+$310M | 7 | |
| Gold & precious metals | ▲+$26.6M | ▲+$206M | ▲+$212M | 3 | |
| Buffer & defined outcome | ▲+$11.4M | ▲+$2.7M | ▲+$37.1M | 8 | |
| Commodities | ▼−$9.5K | ▲+$38.1M | ▲+$67.9M | 6 | |
| Option income | ▼−$14.2M | ▼−$105M | ▼−$143M | 5 | |
| Other | ▼−$83.3M | ▲+$54.1M | ▲+$122M | 14 | |
| Other equity | ▼−$147M | ▲+$2.1B | ▼−$290T | 69 | |
| Real estate | ▼−$378M | ▼−$114M | ▼−$600M | 8 | |
| US large cap & broad market | ▼−$1.4B | ▲+$1.7B | ▲+$547M | 21 | |
| Small & mid cap | ▼−$2.4B | ▲+$3.3B | ▲+$3.2B | 14 |
1–18 of 18
Source: iShares (BlackRock) published daily NAV and shares outstanding; flow = change in shares outstanding x NAV; categories classified from fund names by fixed rules
Fixed income supplied more than 70% of the week's net inflow
Fixed income funds took in $7.0 billion in the week to Oct. 25, more than 70% of the net total and a reversal from a $579 million outflow the week before. Equity funds took in $2.69 billion, down from $14.60 billion. Digital assets, which at iShares means the single fund IBIT, added $630 million after $781 million the prior week and have been positive in all four weeks. The chart's Other bucket lost $533 million, mainly from real estate and multi-asset funds, partly offset by $41 million into commodity funds.
The asset index chart is only a rough guide to direction. Issuer fund records show equity assets of $41.89 billion on Sept. 28 and $41.99 billion on Oct. 23, up 0.2%, and fixed income assets of $9.67 billion and $9.78 billion, up 1.1%. Those totals are smaller than the $43.23 billion SOXX alone held on Oct. 23, so the series cannot be matched to fund-level assets, and it cannot separate new money from price moves.
Chart 60
Weekly net flows by asset class
Asset class as each issuer declares it
- Equity
- Fixed income
- Digital Assets
- Other
Show as table
| Label | Equity | Fixed income | Digital Assets | Other | Total |
|---|---|---|---|---|---|
| Oct 4 | $3.6B | $13.1B | $387.3M | $71.3M | $17.1B |
| Oct 11 | −$289.6T | $7B | $142.6M | $57.2M | −$289.6T |
| Oct 18 | $14.6B | −$579M | $780.6M | $230.3M | $15B |
| Oct 25 | $2.7B | $7B | $630.1M | −$532.7M | $9.8B |
Chart 61
Assets by asset class, indexed to 100
Same 7 funds every day; includes market moves
- Equity
- Fixed income
Show as table
| Period | Equity | Equity (index) | Fixed income | Fixed income (index) |
|---|---|---|---|---|
| Sep 28 | 41.9B | 100.0 | 9.7B | 100.0 |
| Sep 29 | 41.9B | 100.0 | 9.6B | 99.8 |
| Sep 30 | 41.8B | 99.9 | 9.6B | 99.7 |
| Oct 1 | 42B | 100.3 | 9.7B | 99.9 |
| Oct 2 | 42.4B | 101.2 | 9.6B | 99.7 |
| Oct 5 | 42.7B | 101.8 | 9.6B | 99.8 |
| Oct 6 | 42.9B | 102.4 | 9.7B | 99.9 |
| Oct 7 | 42.8B | 102.1 | 9.7B | 99.9 |
| Oct 8 | 42.6B | 101.7 | 9.7B | 100.1 |
| Oct 9 | 42.9B | 102.5 | 9.7B | 100.1 |
| Oct 12 | 43B | 102.6 | 9.7B | 100.4 |
| Oct 13 | 42.9B | 102.5 | 9.7B | 100.5 |
| Oct 14 | 42.5B | 101.4 | 9.7B | 100.4 |
| Oct 15 | 42.5B | 101.6 | 9.7B | 100.8 |
| Oct 16 | 42.1B | 100.6 | 9.7B | 100.8 |
| Oct 19 | 42.3B | 101.1 | 9.7B | 100.6 |
| Oct 20 | 42.5B | 101.4 | 9.7B | 100.7 |
| Oct 21 | 42.8B | 102.1 | 9.7B | 100.7 |
| Oct 22 | 42.1B | 100.6 | 9.8B | 101.3 |
| Oct 23 | 42B | 100.2 | 9.8B | 101.1 |
Active funds took $325 million, their highest of the four weeks
Active funds took in $324.6 million in the week to Oct. 25, about 3% of the net inflow, against $9.46 billion for index funds. Active funds were positive in all four weeks, at $195 million, $310 million, $256 million and $325 million, for $1.09 billion across 21 funds.
Active's share of the net inflow rose from 1.1% in the week to Oct. 4 to 1.7% in the week to Oct. 18 and 3.3% this week. Most of that rise reflects slowing index inflows, from $16.93 billion to $14.78 billion to $9.46 billion over those three weeks, rather than a jump in active flows.
Chart 62
Weekly net flows, active vs index funds
- Active
- Index
Show as table
| Label | Active | Index | Total |
|---|---|---|---|
| Oct 4 | $195M | $16.9B | $17.1B |
| Oct 11 | $310.1M | −$289.6T | −$289.6T |
| Oct 18 | $256.2M | $14.8B | $15B |
| Oct 25 | $324.6M | $9.5B | $9.8B |
Five funds supplied just over half of gross inflows
SOXX, MUB, EMXC, LQD and SGOV together took in $11.04 billion, just over half of the $21.37 billion gross inflow. SOXX took $5.34 billion, MUB $2.30 billion, EMXC $1.44 billion, LQD $1.30 billion and SGOV $659 million. IBIT was next at $630 million. SGOV, the 0-3 month Treasury fund with $116.8 billion in assets as of Oct. 23, has slowed for two weeks, from $1.84 billion in the week to Oct. 11 to $909 million and then $659 million.
Outflows were at least as concentrated. IWM (-$2.46 billion), IVV (-$2.02 billion), IGV (-$1.07 billion), HYG (-$590 million) and IWY (-$433 million) lost $6.57 billion combined, about 57% of the $11.59 billion gross outflow.
Chart 63
Largest fund inflows and outflows, week to Oct 25
- Above zero
- Below zero
- SOXX+$5.3B
- MUB+$2.3B
- EMXC+$1.4B
- LQD+$1.3B
- SGOV+$659.1M
- IWY−$433.2M
- HYG−$589.9M
- IGV−$1.1B
- IVV−$2B
- IWM−$2.5B
Show as table
| Label | Value ($) |
|---|---|
| SOXX | +$5.3B |
| MUB | +$2.3B |
| EMXC | +$1.4B |
| LQD | +$1.3B |
| SGOV | +$659.1M |
| IWM | −$2.5B |
| IVV | −$2B |
| IGV | −$1.1B |
| HYG | −$589.9M |
| IWY | −$433.2M |
Table 2
Largest inflows and outflows, week to Oct 25
| Ticker↕ | Fund↕ | Category↓ | Net flow↕ | Assets↕ | 4 weeks |
|---|---|---|---|---|---|
| IVV | iShares Core S&P 500 ETF | US large cap & broad market | ▼−$2B | $874B | |
| SGOV | iShares 0-3 Month Treasury Bond ETF | Treasuries | ▲+$659M | $117B | |
| TLT | iShares 20+ Year Treasury Bond ETF | Treasuries | ▼−$300M | $47.5B | |
| IWM | iShares Russell 2000 ETF | Small & mid cap | ▼−$2.5B | $74.2B | |
| SOXX | iShares Semiconductor ETF | Sector & thematic | ▲+$5.3B | $43.2B | |
| IGV | iShares Expanded Tech-Software Sector ETF | Sector & thematic | ▼−$1.1B | $14.3B | |
| EWY | iShares MSCI South Korea ETF | Other equity | ▲+$406M | $22.2B | |
| ITB | iShares U.S. Home Construction ETF | Other equity | ▼−$376M | $2.4B | |
| MUB | iShares National Muni Bond ETF | Municipal bonds | ▲+$2.3B | $53.9B | |
| EMXC | iShares MSCI Emerging Markets ex China ETF | International & emerging | ▲+$1.4B | $25.8B | |
| IWX | iShares Russell Top 200 Value ETF | Factor & style | ▲+$483M | $3.9B | |
| IWY | iShares Russell Top 200 Growth ETF | Factor & style | ▼−$433M | $15.4B | |
| IWF | iShares Russell 1000 Growth ETF | Factor & style | ▼−$368M | $122B | |
| IBIT | iShares Bitcoin Trust | Crypto | ▲+$630M | $65.9B | |
| LQD | iShares iBoxx $ Investment Grade Corporate Bond ETF | Corporate & high yield | ▲+$1.3B | $30.2B | |
| HYG | iShares iBoxx $ High Yield Corporate Bond ETF | Corporate & high yield | ▼−$590M | $16.6B |
1–16 of 16
Source: iShares (BlackRock) published daily NAV and shares outstanding; flow = change in shares outstanding x NAV
IWM, IVV and IGV flipped to outflows as SOXX flipped to inflows
IWM, IVV and IGV, which together took in $6.02 billion over the prior three weeks, lost a combined $5.55 billion in the week to Oct. 25. IWM went from $4.88 billion of inflows over three weeks to a $2.46 billion outflow. IVV went from $285 million to -$2.02 billion, and IGV from $857 million to -$1.07 billion. SOXX moved the other way: it lost $3.07 billion over the prior three weeks ($1.46 billion, $512 million and $1.09 billion), then took in $5.34 billion. Semiconductors came in and software went out in the same week, which suggests a rotation inside technology rather than a broad move in the sector, though one week of flows does not establish a trend.
HYG's reversal has been more gradual. Its prior three-week total was a $1.64 billion inflow, but all of it came in the week to Oct. 4 ($2.31 billion). It has lost money in each of the three weeks since, deepening from $308 million to $362 million to $590 million, while LQD took in $1.30 billion this week. IWX, the Russell Top 200 Value fund, went from an average weekly outflow of $179 million over the prior three weeks to a $483 million inflow. The Russell Top 200 Growth fund IWY lost $433 million and the Russell 1000 Growth fund IWF lost $368 million.
Chart 64
Reversals: prior three-week average vs this week
Show as table
| Item | 3-week avg | This week | Change |
|---|---|---|---|
| SOXX | −$1B | $5.3B | +$6.4B |
| IWM | $1.6B | −$2.5B | −$4.1B |
| IVV | $94.9M | −$2B | −$2.1B |
| IGV | $285.7M | −$1.1B | −$1.4B |
| HYG | $547M | −$589.9M | −$1.1B |
| IWX | −$178.5M | $483.1M | +$661.6M |
Methodology and sources
Flows are computed from issuers' own published daily fund records: each day's flow is the change in shares outstanding multiplied by that day's net asset value. Only issuers whose daily records we capture are covered (iShares (BlackRock)), so totals describe those funds, not the whole ETF market. A fund is left out of a week when its records for the period come from more than one source. Weeks run Monday to Sunday and are labelled by their last day. Categories are assigned from each fund's registered name by fixed, ordered rules, so every dollar counts once; asset class is the issuer's own classification; a fund is active when its SEC record or registered name says so. Reversals are funds whose net flow this week, and over the prior three weeks combined, were each at least $10 million and ran in opposite directions. Asset totals in the indexed chart include market moves as well as flows.
Key numbers
- Net flows, the week: iShares (BlackRock) published daily NAV and shares outstanding; flow = change in shares outstanding x NAV
- Gross inflows: iShares (BlackRock) published daily NAV and shares outstanding; flow = change in shares outstanding x NAV
- Gross outflows: iShares (BlackRock) published daily NAV and shares outstanding; flow = change in shares outstanding x NAV
- Top five funds' share of inflows: iShares (BlackRock) published daily NAV and shares outstanding; flow = change in shares outstanding x NAV
- Funds covered: iShares (BlackRock) published daily NAV and shares outstanding; flow = change in shares outstanding x NAV
PWD Intelligence
The ETF Flow Report
New editions publish on a fixed schedule. Follow the series to see each one on My Desk.
Free. Every morning. Unsubscribe from any edition in one click.