PWD IntelligenceThe ETF Flow ReportWeek of Nov 9
Net flows, the week
$17.4B
up $9.9BChange vs the prior week
Source for Net flows, the week
Source: iShares (BlackRock) published daily NAV and shares outstanding; flow = change in shares outstanding x NAViShares ETF inflows more than double to $17.4 billion
Equity funds took in $13.3 billion of that total, nearly five times the prior week, according to iShares' published daily fund data.
Share
By PWD Intelligence8 min read
Gross inflows
$24.9B
251 funds took in money
Source for Gross inflows
Source: iShares (BlackRock) published daily NAV and shares outstanding; flow = change in shares outstanding x NAVGross outflows
−$7.5B
179 funds lost money
Source for Gross outflows
Source: iShares (BlackRock) published daily NAV and shares outstanding; flow = change in shares outstanding x NAVTop five funds' share of inflows
48.6%
IVV, IWM, TLT, IEF, LQD
Source for Top five funds' share of inflows
Source: iShares (BlackRock) published daily NAV and shares outstanding; flow = change in shares outstanding x NAVFunds covered
431
Issuers: iShares (BlackRock)
Source for Funds covered
Source: iShares (BlackRock) published daily NAV and shares outstanding; flow = change in shares outstanding x NAVWhat matters
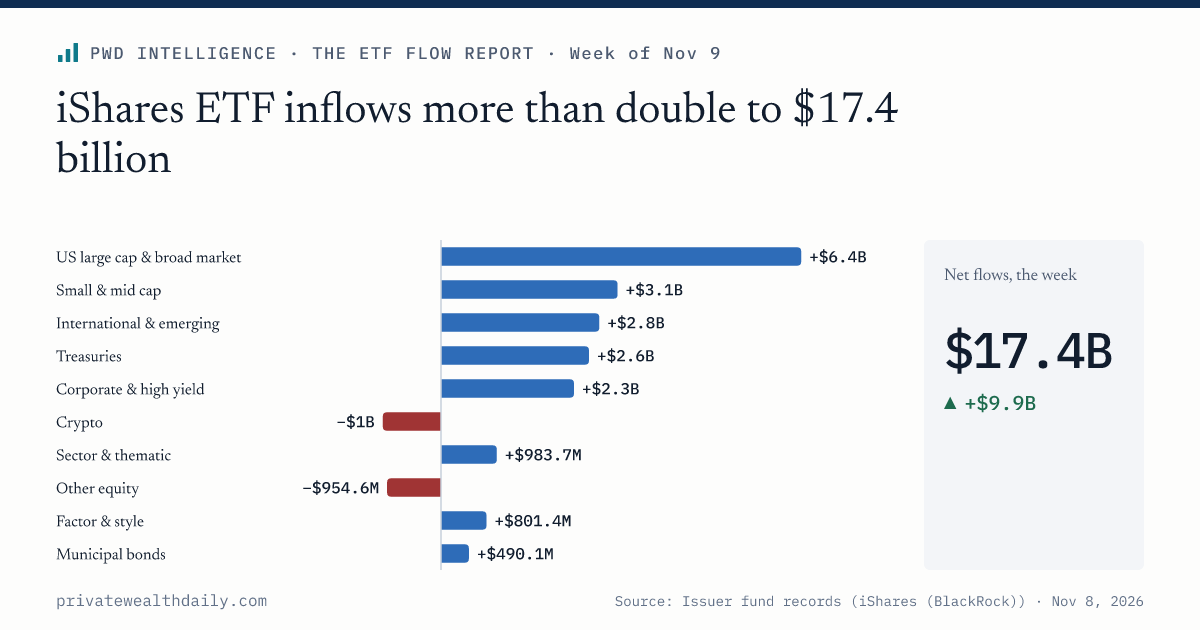
- iShares ETFs took in $17.4 billion in the week to Nov 8, up from $7.5 billion the week before and the highest of the past four weeks, according to iShares' published daily fund data.
- US large cap & broad market funds took in $6.36 billion in the week to Nov 8, up from $1.34 billion the week before, according to iShares' published daily fund data.
- The iShares Bitcoin Trust (IBIT) lost $1.03 billion in the week to Nov 8 after averaging $567.7 million of weekly inflows over the prior three weeks, according to iShares' published daily fund data.
Chart 1
Net ETF flows by category, week to Nov 8
Inflows above zero, outflows below; issuer-reported funds only
- Above zero
- Below zero
- US large cap & broad market+$6.4B
- Small & mid cap+$3.1B
- International & emerging+$2.8B
- Treasuries+$2.6B
- Corporate & high yield+$2.3B
- Sector & thematic+$983.7M
- Factor & style+$801.4M
- Municipal bonds+$490.1M
- Other equity−$954.6M
- Crypto−$1B
Show as table
| Label | Value ($) |
|---|---|
| US large cap & broad market | +$6.4B |
| Small & mid cap | +$3.1B |
| International & emerging | +$2.8B |
| Treasuries | +$2.6B |
| Corporate & high yield | +$2.3B |
| Crypto | −$1B |
| Sector & thematic | +$983.7M |
| Other equity | −$954.6M |
| Factor & style | +$801.4M |
| Municipal bonds | +$490.1M |
iShares ETFs took in a net $17.4 billion in the week to Nov. 8, up from $7.5 billion the week before, according to iShares' published daily fund data. It was the best of the past four weeks, about 16% above the $15.0 billion of the week to Oct. 18. The figures cover 431 iShares funds with $4.39 trillion in assets. They are not a market-wide ETF total.
IVV and IWM together took in $8.9 billion, about 51% of the week's net total, according to iShares' published daily fund data. Gross inflows were $24.9 billion against $7.5 billion of gross outflows. Of the 431 funds, 251 took in money and 179 lost it.
For advisors using iShares core bond funds in client models, the week split: AGG, the Core U.S. Aggregate Bond ETF, lost $924 million while Treasury funds TLT and IEF took in $2.35 billion. In crypto, the iShares Bitcoin Trust (IBIT) had a $1.03 billion outflow after three weeks of shrinking inflows.
Chart 2
Net flows by week
Weeks ending on the date shown
- Inflow / above zero
- Outflow / below zero
Show as table
| Label | Value ($) |
|---|---|
| Oct 18 | $15B |
| Oct 25 | $9.8B |
| Nov 1 | $7.5B |
| Nov 8 | $17.4B |
Four weeks of net flows across every covered fund.
Large-cap, small-cap and Treasury funds led the categories
US large cap and broad market funds took in $6.36 billion, up from $1.34 billion the week before, according to iShares' published daily fund data. Small and mid cap funds added $3.11 billion, against $1.97 billion the prior week. International and emerging funds took in $2.79 billion.
Treasuries swung hardest among the leaders, taking in $2.61 billion after an $803 million outflow the prior week. Corporate and high yield funds took in $2.35 billion, down from $3.78 billion, but positive for a fourth straight week.
The outflows were smaller. Crypto lost $1.03 billion. The Other equity category lost $955 million, its second straight weekly outflow of about that size. Real estate lost $336 million and has had outflows in each of the four weeks, totaling $837 million. Broad bonds lost $198 million after taking in $971 million the prior week.
Table 1
Net flows by category
| Category↕ | This week↓ | Prior week↕ | Four weeks↕ | Funds↕ | 4 weeks |
|---|---|---|---|---|---|
| US large cap & broad market | ▲+$6.4B | ▲+$1.3B | ▲+$8B | 20 | |
| Small & mid cap | ▲+$3.1B | ▲+$2B | ▲+$6B | 13 | |
| International & emerging | ▲+$2.8B | ▲+$820M | ▲+$7.3B | 72 | |
| Treasuries | ▲+$2.6B | ▼−$803M | ▲+$948M | 31 | |
| Corporate & high yield | ▲+$2.3B | ▲+$3.8B | ▲+$8.2B | 49 | |
| Sector & thematic | ▲+$984M | ▲+$1.3B | ▲+$6.2B | 26 | |
| Factor & style | ▲+$801M | ▼−$1.8B | ▲+$5.1B | 41 | |
| Municipal bonds | ▲+$490M | ▲+$297M | ▲+$5.5B | 16 | |
| Dividend & income | ▲+$354M | ▼−$47.3M | ▲+$603M | 7 | |
| Gold & precious metals | ▲+$78.9M | ▲+$251M | ▲+$563M | 3 | |
| Buffer & defined outcome | ▲+$20.4M | ▲+$1.1M | ▲+$35.6M | 8 | |
| Option income | ▲+$1.8M | ▲+$6M | ▼−$111M | 5 | |
| Other | ▼−$3.5M | ▲+$23.9M | ▼−$8.8M | 14 | |
| Commodities | ▼−$12.2M | ▲+$63.7M | ▲+$89.6M | 6 | |
| Broad bonds | ▼−$198M | ▲+$971M | ▲+$1.4B | 41 | |
| Real estate | ▼−$336M | ▼−$9.5M | ▼−$837M | 8 | |
| Other equity | ▼−$955M | ▼−$930M | ▲+$116M | 69 | |
| Crypto | ▼−$1B | ▲+$292M | ▲+$673M | 2 |
1–18 of 18
Source: iShares (BlackRock) published daily NAV and shares outstanding; flow = change in shares outstanding x NAV; categories classified from fund names by fixed rules
Equity returned to its Oct. 18 pace as fixed income held up
Equity funds took in $13.31 billion, up from $2.73 billion the prior week, according to iShares' published daily fund data. That matches the pace of the week to Oct. 18, when equity took in $14.60 billion, rather than setting a new high.
Fixed income took in $5.27 billion, up from $4.25 billion. It has taken in money for three straight weeks, peaking at $7.00 billion in the week to Oct. 25, after a $579 million outflow in the week to Oct. 18. Over the four weeks, equity took in $33.3 billion and fixed income $15.9 billion.
The remaining asset classes netted to an outflow. Digital assets, which in iShares' data is the single fund IBIT, lost $1.03 billion, and real estate lost $268 million. Commodity funds (+$108 million) and multi-asset funds (+$28 million) did not offset that.
On the asset series charted below, equity assets fell about 5.5%, from $42.97 billion on Oct. 12 to $40.62 billion on Nov. 6, according to iShares' published fund records. Fixed income assets rose about 1.7%, from $9.71 billion to $9.87 billion. Those levels are small next to the $852.9 billion IVV alone held on Nov. 6, so the series likely covers part of the iShares book and is best read for direction.
Chart 3
Weekly net flows by asset class
Asset class as each issuer declares it
- Equity
- Fixed income
- Real estate
- Other
Show as table
| Label | Equity | Fixed income | Real estate | Other | Total |
|---|---|---|---|---|---|
| Oct 18 | $14.6B | −$579M | −$94M | $1.1B | $15B |
| Oct 25 | $2.7B | $7B | −$388.5M | $485.9M | $9.8B |
| Nov 1 | $2.7B | $4.2B | $1.8M | $571.1M | $7.5B |
| Nov 8 | $13.3B | $5.3B | −$267.5M | −$893.1M | $17.4B |
Chart 4
Assets by asset class, indexed to 100
Same 7 funds every day; includes market moves
- Equity
- Fixed income
Show as table
| Period | Equity | Equity (index) | Fixed income | Fixed income (index) |
|---|---|---|---|---|
| Oct 12 | 43B | 100.0 | 9.7B | 100.0 |
| Oct 13 | 42.9B | 99.9 | 9.7B | 100.1 |
| Oct 14 | 42.5B | 98.8 | 9.7B | 100.0 |
| Oct 15 | 42.5B | 99.0 | 9.7B | 100.3 |
| Oct 16 | 42.1B | 98.0 | 9.7B | 100.4 |
| Oct 19 | 42.3B | 98.5 | 9.7B | 100.2 |
| Oct 20 | 42.5B | 98.8 | 9.7B | 100.3 |
| Oct 21 | 42.8B | 99.5 | 9.7B | 100.3 |
| Oct 22 | 42.1B | 98.1 | 9.8B | 100.9 |
| Oct 23 | 42B | 97.7 | 9.8B | 100.7 |
| Oct 26 | 42.4B | 98.7 | 9.8B | 101.0 |
| Oct 27 | 42.7B | 99.3 | 9.8B | 101.1 |
| Oct 28 | 42.9B | 99.8 | 9.8B | 101.0 |
| Oct 29 | 42.6B | 99.2 | 9.8B | 101.2 |
| Oct 30 | 41.8B | 97.3 | 9.9B | 101.6 |
| Nov 2 | 41.5B | 96.6 | 9.8B | 101.3 |
| Nov 3 | 41.8B | 97.2 | 9.8B | 101.2 |
| Nov 4 | 42.3B | 98.3 | 9.8B | 101.5 |
| Nov 5 | 40.4B | 94.0 | 9.9B | 101.7 |
| Nov 6 | 40.6B | 94.5 | 9.9B | 101.7 |
Active funds drew $294 million, 1.7% of the week's net
Active iShares funds took in $293.7 million in the week, against $17.12 billion for index funds, according to iShares' published daily fund data. Active's share of the net total fell to 1.7% from 3.1% the week before.
Active flows stayed between $233.7 million and $324.6 million in each of the four weeks, $1.11 billion in total. The jump in the weekly total came from index funds, which went from $7.31 billion to $17.12 billion. The data cover 21 active funds and 410 index funds.
Chart 5
Weekly net flows, active vs index funds
- Active
- Index
Show as table
| Label | Active | Index | Total |
|---|---|---|---|
| Oct 18 | $256.2M | $14.8B | $15B |
| Oct 25 | $324.6M | $9.5B | $9.8B |
| Nov 1 | $233.7M | $7.3B | $7.5B |
| Nov 8 | $293.7M | $17.1B | $17.4B |
IVV and IWM supplied about half of the week's net flow
IVV, the iShares Core S&P 500 ETF, took in $6.24 billion, the week's largest fund inflow, followed by IWM, the iShares Russell 2000 ETF, at $2.64 billion, according to iShares' published daily fund data. Both had outflows in the week to Oct. 25: $2.02 billion for IVV and $2.46 billion for IWM. IVV's latest week exceeds its four-week net of $6.17 billion. IWM's is about 86% of its four-week net of $3.07 billion.
Treasury funds TLT and IEF took the next two slots, and LQD took in $871 million. The five largest inflows total $12.10 billion, about 49% of gross inflows.
Outflows were less concentrated. The five largest were IBIT (-$1.03 billion), AGG (-$924 million), IVW (-$414 million), EWT (-$404 million) and EWZ (-$382 million). They total $3.15 billion, about 42% of gross outflows. EWT and EWZ both sit in the Other equity category.
Chart 6
Largest fund inflows and outflows, week to Nov 8
- Above zero
- Below zero
- IVV+$6.2B
- IWM+$2.6B
- TLT+$1.3B
- IEF+$1.1B
- LQD+$871.2M
- EWZ−$381.9M
- EWT−$403.8M
- IVW−$414.2M
- AGG−$923.5M
- IBIT−$1B
Show as table
| Label | Value ($) |
|---|---|
| IVV | +$6.2B |
| IWM | +$2.6B |
| TLT | +$1.3B |
| IEF | +$1.1B |
| LQD | +$871.2M |
| IBIT | −$1B |
| AGG | −$923.5M |
| IVW | −$414.2M |
| EWT | −$403.8M |
| EWZ | −$381.9M |
Table 2
Largest inflows and outflows, week to Nov 8
| Ticker↕ | Fund↕ | Category↕ | Net flow↕ | Assets↓ | 4 weeks |
|---|---|---|---|---|---|
| IVV | iShares Core S&P 500 ETF | US large cap & broad market | ▲+$6.2B | $853B | |
| AGG | iShares Core U.S. Aggregate Bond ETF | Broad bonds | ▼−$924M | $139B | |
| IWM | iShares Russell 2000 ETF | Small & mid cap | ▲+$2.6B | $76.6B | |
| IVW | iShares S&P 500 Growth ETF | Factor & style | ▼−$414M | $71.7B | |
| IBIT | iShares Bitcoin Trust | Crypto | ▼−$1B | $60.7B | |
| TLT | iShares 20+ Year Treasury Bond ETF | Treasuries | ▲+$1.3B | $48.9B | |
| IEF | iShares 7-10 Year Treasury Bond ETF | Treasuries | ▲+$1.1B | $44.6B | |
| SOXX | iShares Semiconductor ETF | Sector & thematic | ▲+$675M | $39.1B | |
| LQD | iShares iBoxx $ Investment Grade Corporate Bond ETF | Corporate & high yield | ▲+$871M | $33B | |
| USHY | iShares Broad USD High Yield Corporate Bond ETF | Corporate & high yield | ▲+$852M | $27.5B | |
| IGV | iShares Expanded Tech-Software Sector ETF | Sector & thematic | ▼−$342M | $12.4B | |
| ITA | iShares U.S. Aerospace & Defense ETF | Other equity | ▼−$270M | $11.7B | |
| URTH | iShares MSCI World ETF | International & emerging | ▲+$846M | $9.6B | |
| EWT | iShares MSCI Taiwan ETF | Other equity | ▼−$404M | $9.4B | |
| EWZ | iShares MSCI Brazil ETF | Other equity | ▼−$382M | $9.1B | |
| IXC | iShares Global Energy ETF | International & emerging | ▼−$377M | $2.7B |
1–16 of 16
Source: iShares (BlackRock) published daily NAV and shares outstanding; flow = change in shares outstanding x NAV
IBIT and AGG turned to outflows as TLT turned to inflows
The iShares Bitcoin Trust (IBIT) lost $1.03 billion in the week to Nov. 8 after averaging $567.7 million of weekly inflows over the prior three weeks, according to iShares' published daily fund data. Those inflows had shrunk from $781 million to $630 million to $292 million. The outflow equals about 1.7% of the fund's $60.7 billion in assets on Nov. 6.
AGG's $924 million outflow followed an average of $34.2 million of weekly inflows. TLT went the other way, taking in $1.30 billion after three weeks of outflows totaling $3.55 billion, an average of $1.18 billion a week.
The equity reversals were smaller. IXUS, the iShares Core MSCI Total International Stock ETF, took in $603 million after averaging a $37.7 million weekly outflow. IVW, the iShares S&P 500 Growth ETF, lost $414 million after averaging $137.4 million of weekly inflows. IVV's inflow followed a prior three-week average outflow of $23.1 million, so it broke from a roughly flat pattern rather than reversing a trend.
Chart 7
Reversals: prior three-week average vs this week
Show as table
| Item | 3-week avg | This week | Change |
|---|---|---|---|
| IVV | −$23.1M | $6.2B | +$6.3B |
| TLT | −$1.2B | $1.3B | +$2.5B |
| IBIT | $567.7M | −$1B | −$1.6B |
| AGG | $34.2M | −$923.5M | −$957.7M |
| IXUS | −$37.7M | $603.2M | +$641M |
| IVW | $137.4M | −$414.2M | −$551.6M |
PWD Intelligence
The ETF Flow Report
New editions publish on a fixed schedule. Follow the series to see each one on My Desk.
Free. Every morning. Unsubscribe from any edition in one click.
From other sections
- Wealth Advisor DailyBitcoin's $1 million ETF swap beckons advisors
- Digital Capital DailyBlackRock's IBIT accounts for 94% of weekly spot bitcoin ETF outflows
- ETF DailyInvesco's QQQM drew $27 billion as 0.10% Nasdaq-100 rivals launched
- Features19 RIA deals in a week as Mariner seeks $150 million in debt